illing of Old Knowledge onto New Ways of Learning
Dr. Robert E. Landsman is a research scientist with extensive experience in K-12 scientific inquiry-based curriculum and program development across all grade levels, 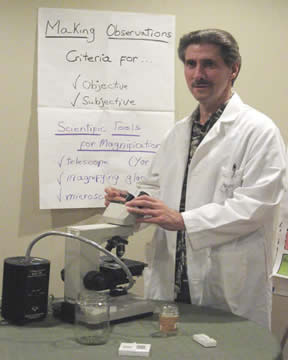 augmented by a vast array of teaching positions and experiences from the middle and high school levels to the university undergraduate and graduate levels. The Research Investigation Process, or RIP®, scientific inquiry STEM model he developed was given the impact evidence-based distinction of Exemplary Science Education Program by the National Science Teachers Association in 2006. Dr. Landsman has published and presented numerous papers and book chapters in the field of neuroscience and on science teaching and curriculum development. Between 2005-2006, he authored three books on scientific inquiry: RIP~ing Through Scientific Inquiry, Data Analysis and Decision Making in Scientific Inquiry, and Look at Me Now: Motivate Young Minds to Think and Learn Through Scientific Inquiry. His latest book, Look at Us Now! Making Scientific Practices Matter in the Classroom…and Beyond, was published October 1, 2012. He is the recipient of a number of awards and recognitions in both science and education, received his PHD in biopsychology/neuroscience from the Graduate Center of the City University of New York in conjunction with the American Museum of Natural History, and was a Post-Doctoral Scholar at both the UCLA School of Medicine’s Brain Research Institute and the Laboratory of Neuroendocrinology.
Mr. R. Gordon Schaubhut has an extensive STEM background reflected in both his education and career experiences. Mr. Schaubhut ear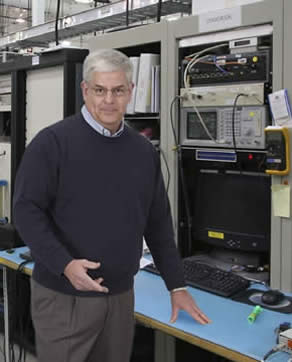 ned his engineering degrees (BSEE and MEEE) with a minor in mathematics from Stevens Institute of Technology. He served as Director of Engineering at ITT Force Protection Systems and Manager of Center of Excellence Systems Engineering at ITT Space Systems Division. Mr. Schaubhut has a 35 year background at ITT and Raytheon in Radar Electronic Countermeasures, GPS Satellite, and Communications Systems Engineering. In addition to a myriad of leadership roles spanning a vast variety of engineering product areas and sub-fields, his positions included Chief Electronic Systems Engineer for the US Navy and Marine Corps JCREW 3.3 electronic countermeasures program, Lead Project Engineer for the USAir Force GPS Satellite IIR-M and IIF production systems, and Engineering Project Lead for the US Army SINCGARS ASIP, NTDR, and British Ministry of Defence BOWMAN VHF radio systems. He is joint author of the ITT Communication Systems, Engineering Process Manual® (1999). In addition to his experience as a practicing engineer, his certifications in engineering processes and practices include a Green Belt in Value Based Six Sigma from the University of Michigan and a certification from Carnegie Melon University’s Software Engineering Institute in Intermediate Concepts of Capability Maturity Model® Integration (CMMI®).
lling of Old Knowledge onto New Ways of Learning
RIP® Model—More Emphasis Conditions and the Four Goals of Science Education
The outcome of implementation of RIP scientific inquiry into the classroom is the achievement of the National Science Education Standards’ (NSES) More Emphasis conditions for teaching, assessment, content, professional development, and program, leading to attainment of the NSES four goals of science education (Landsman, 2005b, 2012; National Research Council, 1996). This has been extensively discussed in Landsman (2005b, 2012).
The NSES’ More Emphasis conditions describe changes that are necessary to achieve the visions for science education described in the standards (Achieve, 2013a; National Research Council, 1996). They reflect actions and activities pertaining to teaching, professional development, assessment, content, program, and system related standards, on which more emphasis should be placed in contrast to actions and activities that should receive less emphasis (Less Emphasis conditions). For example, according to both the NSES and the NGSS, at every grade level, students are expected to be undertaking complete investigations. To achieve this with full student involvement in all aspects, students perform extended investigations that last longer than one or two class periods versus their conducting traditional investigations that take a single class period (National Research Council, 1996, 2000).
RIP scientific investigations place the student at the center of the learning experience. The investigation idea originates from the students’ own experiences and addresses their own research questions. Students test the viability of their own proposed answers through designing and conducting their own studies. All of these actions are personalized leading students to “experience the richness and excitement of knowing about and understanding the natural world” (Goal 1, National Research Council, 1996). The RIP is a critical thinking model based on scientific inquiry. It promotes the development of student skills for making data driven decisions, enabling the student to become a critical consumer of information by utilizing “appropriate scientific processes and principles in making personal decisions” (Goal 2, National Research Council, 1996). Throughout the RIP model, students communicate amongst themselves and with others to further their investigation, for assessment purposes, and/or to share and discuss their work. This communication typically involves them engaging “intelligently in public discourse and debate about matters of scientific and technological concern” (Goal 3, National Research Council, 1996). The RIP also fosters development of student observation, questioning, and communication skills, together with analytical and critical thinking skills. Students take these skills with them throughout their personal lives and careers and use them to “increase their economic productivity through the use of knowledge, understanding, and the skills of the scientifically literate person in their careers” (Goal 4, National Research Council, 1996). Sections III and IV of this chapter present qualitative and quantitative evidence indicating that engaging in teaching and learning through the RIP model fosters positive attitudes towards learning STEM content and the development of abilities necessary to achieve the four goals of science education.
RIP® Model—Full and Open Inquiry
Both the NGSS and NSES specify that students at all grade levels are to engage in complete scientific investigations (Achieve, 2013a, 2013b; National Research Council, 1996). The investigations that are presented in the next section (Section III) illustrate how the RIP is an inquiry-based critical thinking approach to STEM learning that provides opportunities for students to engage in “full” and “open” inquiry, or “partially” open inquiry (especially during initial implementation in the classroom and for primary grades). “Full” inquiry is when students engage in all of the components involved in a scientific investigation [research investigation] (Colburn, 2000; Martin-Hansen, 2002; National Research Council, 1996). “Open” inquiry is student-centered (initiated by students, the method to be used designed by students and/or with significant student input, and conducted by students) and of interest and/or of relevance to the student. The ultimate goal of RIP® based inquiry is to have students lead the thinking and performance of actions required within all of the components of the investigation (“completely open”). It is, in part, because of the full and openness of the inquiries themselves that the RIP engages students in a STEM learning experience. The RIP® model of scientific inquiry is designed to foster development and application of scientific and engineering practices for thinking and learning in any content area. RIP® enables and facilitates the learner to not only engage in every aspect of the investigation, but also to assume a leadership role in all aspects of the investigation (where developmentally and experientially feasible), from conception through culmination of the investigation process.
"Students do not come to understand inquiry simply by learning words such as ‘hypothesis’ and ‘inference’ or by memorizing procedures such as ‘the steps of the scientific method.’ They must experience inquiry directly to gain a deep understanding of its characteristics” (National Research Council, 2000, p. 14). “Engaging in ‘full and open’ inquiry (National Research Council, 2000) using the RIP® is consistent with the scientific inquiry and scientific practices described in the NSES and NGSS and is characterized by investigations based on scientific questions students pose that lead them to designing tests of their hypotheses, with students collecting data, analyzing it, and using it as evidence to support or refute their explanation; students demonstrating application of scientific and other (i.e., language arts and social studies, etc.) content knowledge to their results and communication of this in their discussion and conclusions (criteria adapted from National Research Council, 2000, p. 29)" [Landsman and Kamimura, 2012, pp. 7-8].
wledge onto New Ways of Learning
Figure 1. The Research Investigation Process (RIP®) scientific inquiry model components.
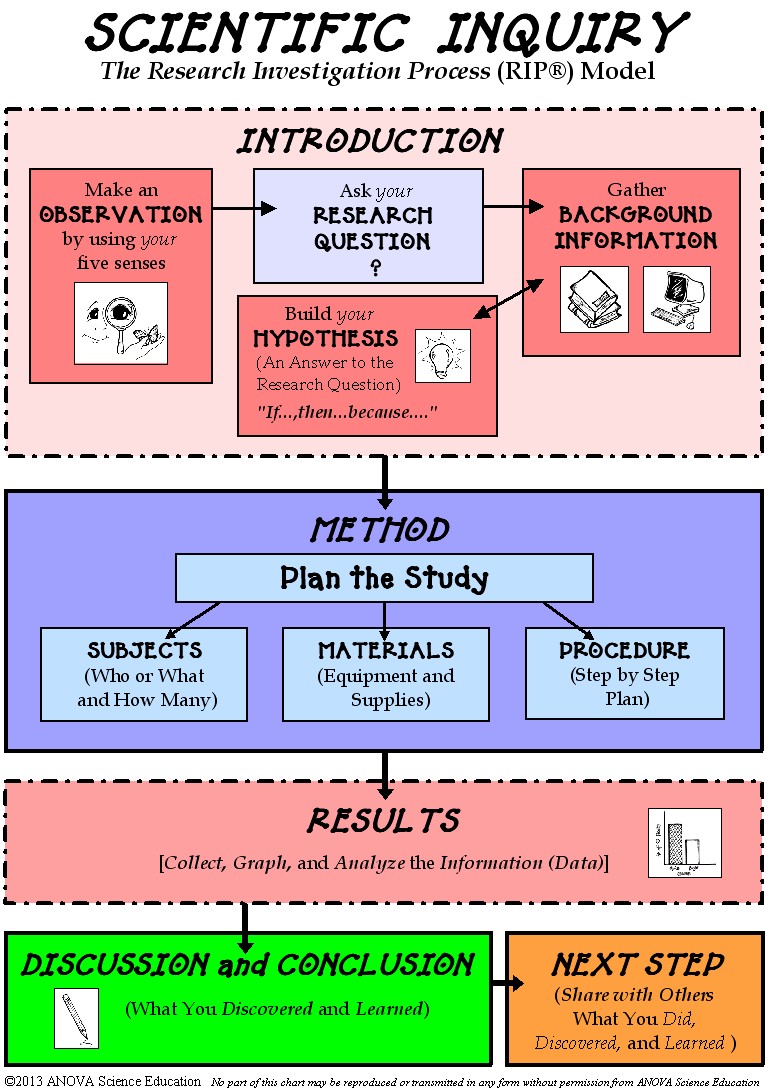
The Research Investigation Process (RIP®) flowchart. When first introduced to this education model, students are encouraged to follow the flow of the arrows as they progress through and become proficient in the skills and practices associated with each component. Once students become more experienced with the RIP and/or developmentally ready, they are encouraged to exercise flexibility in how and where they enter and progress through the RIP components. For example, it is not uncommon for a middle or high school student to launch their inquiry within the context of the Method or Results component of an already published paper. They might develop a research question based on a methodological weakness they have observed such as an inappropriate research design or challenge the validity of using a particular data analysis technique.
owledge onto New Ways of Learning |
||||||
|---|---|---|---|---|---|---|
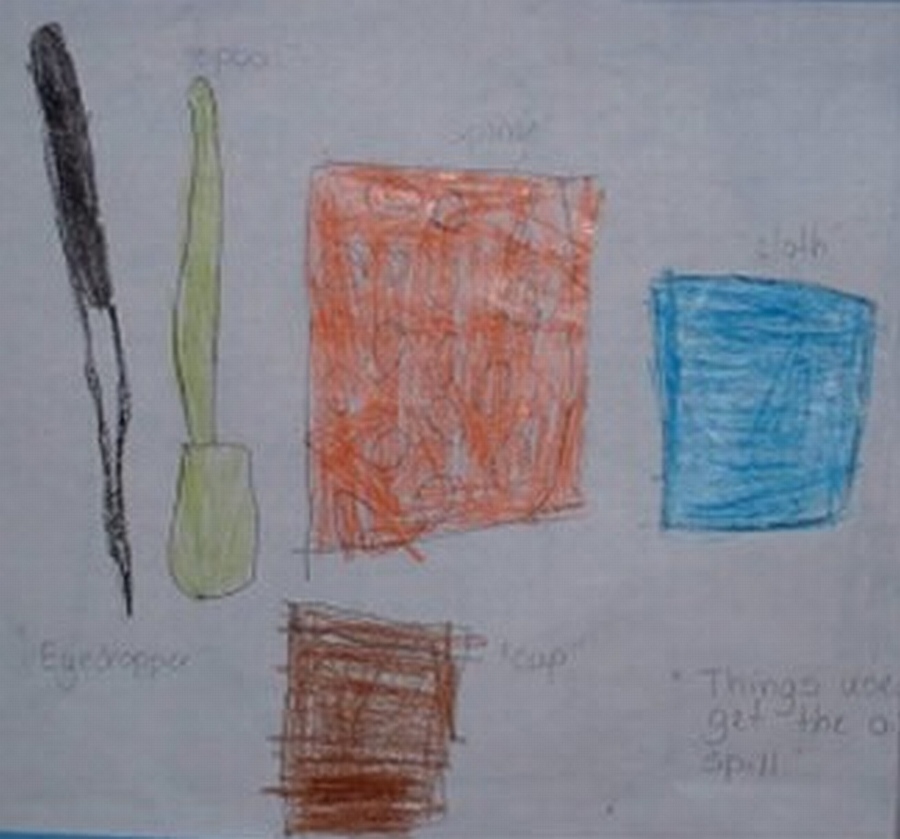
| Figure 2. Tools/technologies for cleaning up an ocean oil spill proposed by Ms. LoRusso’s Year 1 Kindergarten students. | ||||||
|
||||||
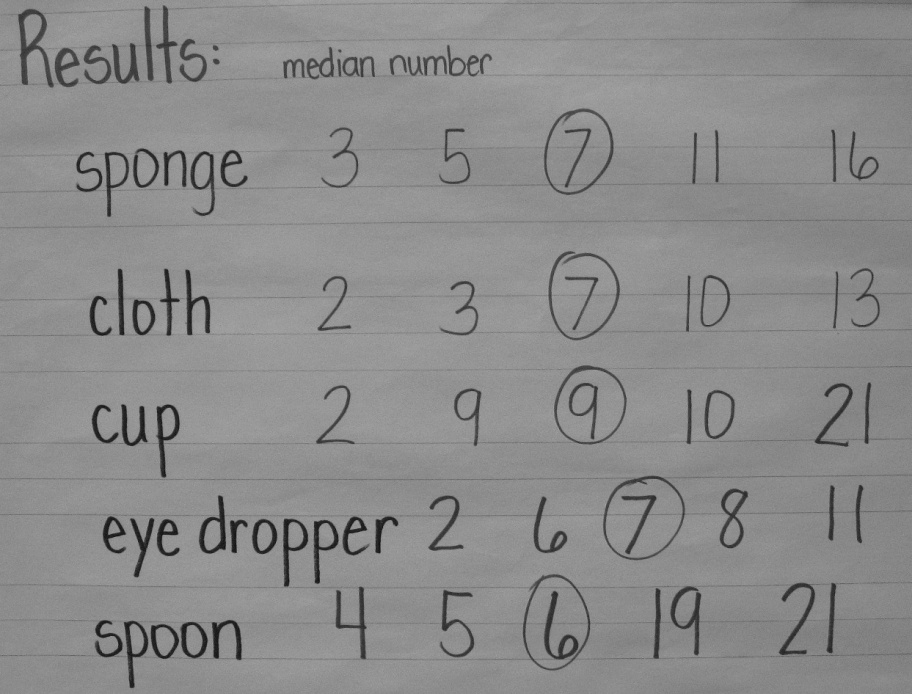
| Figure 3. Year 2 Grade K student-generated data table. “To calculate the median, we put the numbers in order from smaller number to the big numbers. We circled the middle number” (quote from the Year 1 students). |
||||||
|
||||||
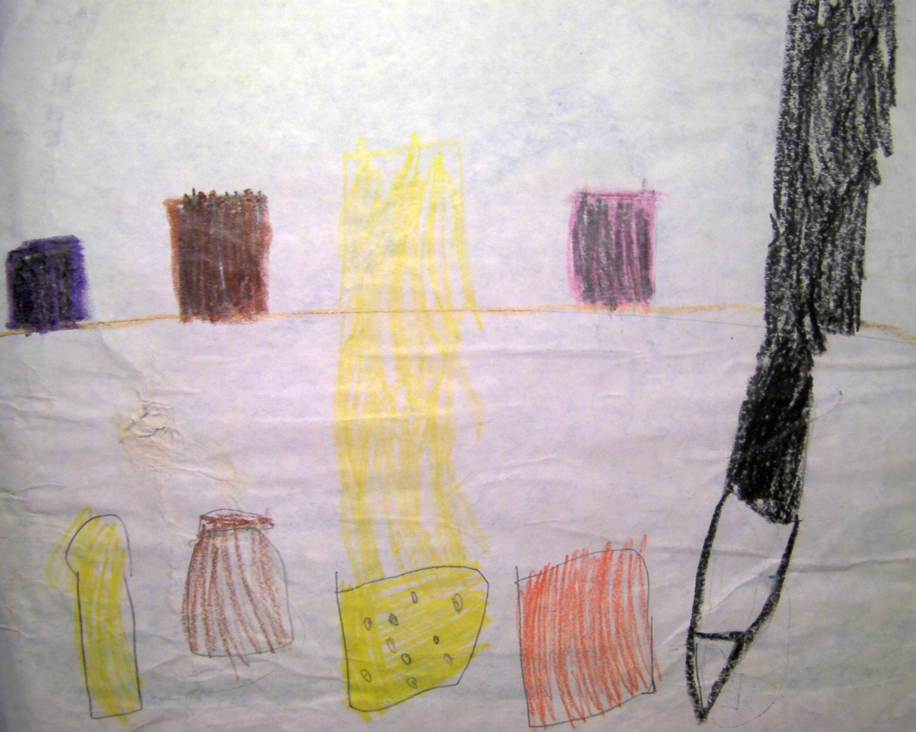
| Figure 4. A Year 1 Grade K oil spill student-drawn bar graph showing the relative amount of oil picked up by each of the tools. From left to right: spoon, cup, sponge, cloth, and eyedropper (from LoRusso, 2012). | ||||||
|
||||||
| Figure 5. Grade K student-built model: the "Oil Vaccum [sic]." As explained by the student designer, "One hose goes in the water and the other hose goes in the oil spill truck. It sucks up the oil and water and it separates the oil from the water. The water goes back to the ocean and the oil goes into the truck and takes it away." | ||||||
|
||||||
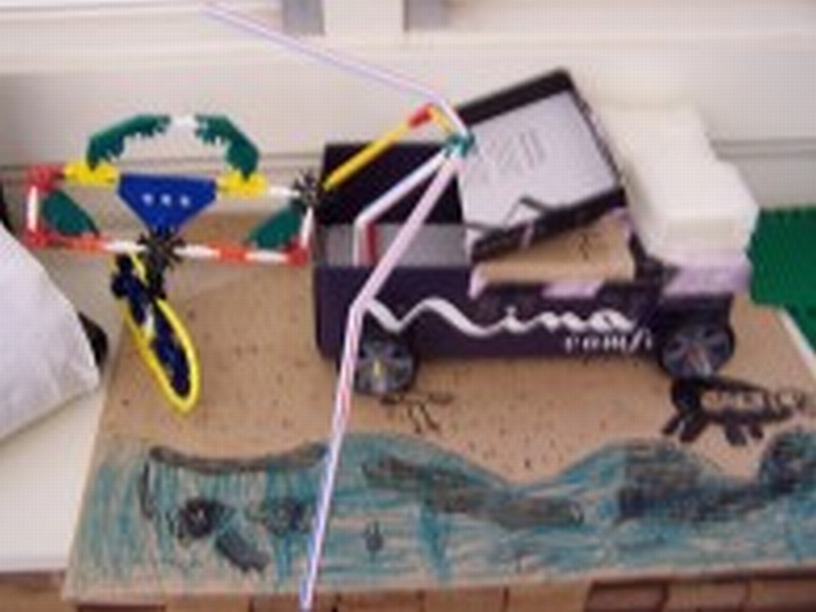
| Figure 6. Grade K student-built"Fudoom" model. Top) Student- built oil spill clean-up boat model. Note the large eyedropper suspended at the top of the mast. Bottom) Student designer's own handwritten description of how her Fudoom model works. | ||||||
|
||||||
“The eye dropper
leans over and sucks up the oil and water. Then it
swings back and squirts it into the separating When the oil comes to the bottom of the container we clip it so it can’t come out.” |
||||||
| Figure 7. Grade 7 student-built ocean oil spill model. Note the shoreline environmental features containing wildlife (blue and black bird feathers), stones, etc. | ||||||
|
||||||
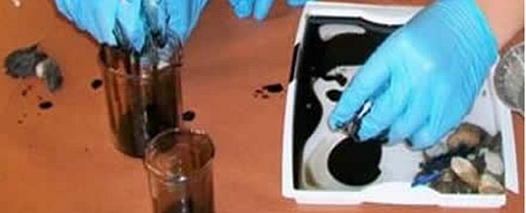
| Figure 8. Grade 7 students used an air pump to simulate ocean wave action to disperse oil in their ocean models. | ||||||
|
||||||
| Figure 9. Close-up of absorbing the oil with a cotton ball and squeezing it out into a beaker for measurement. | ||||||
|
||||||
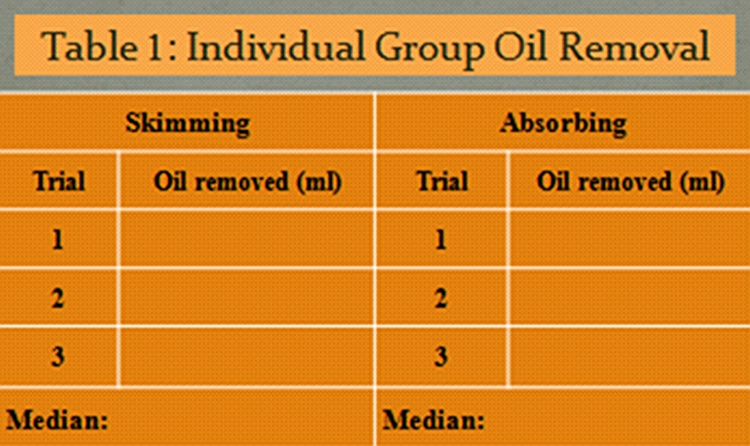
| Figure 10. Data table used by one group of Grade 7 students to collect and organize their oil collection data and for summarizing their data as medians. | ||||||
|
||||||
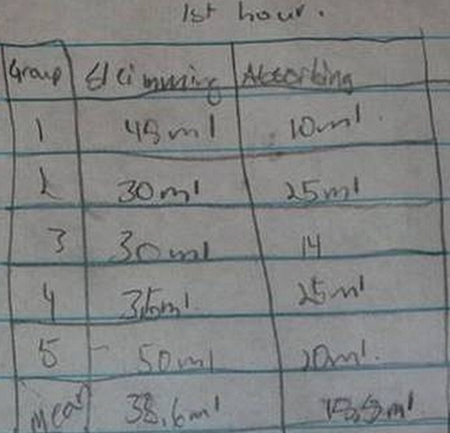
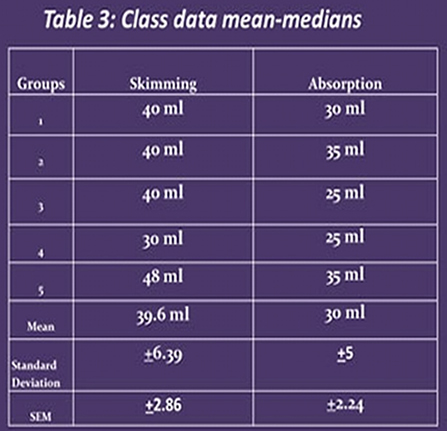
| Figure 11. Two examples of the class data tables constructed by the 7th graders. Left) A first period student's handwritten class data table, Right) For Period 5, skimming and absorption medians were entered for each of the five groups and then means and error [standard deviation and standard error of the mean (SEM)] calculated. | ||||||
|
||||||
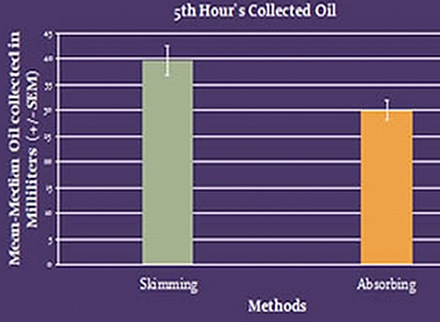
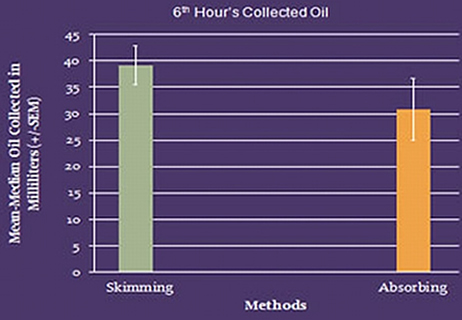
Figure 12. Period 5 (left) and Period 6 (right) Grade 7 classes' mean-median graphs (+ standard error of the mean, SEM) for each of the oil spill cleanup methods. |
||||||
|
||||||
Note the larger error bars (+ SEM vertical lines shown in white) on the 6th hour class's skimming and absorbing means (right graph) compared to those for the 5th hours class's skimming and absorbing means (left graph). |
||||||
|
||||||
|
||||||
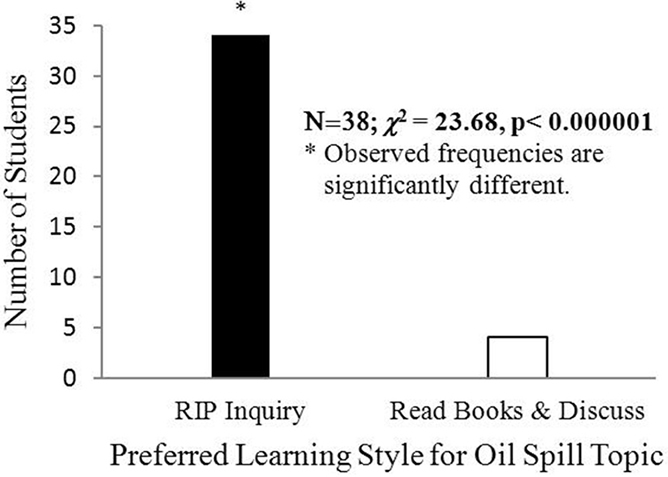
Figure 13. Significantly more Year 1 and 2 Grade K oil spill students reported that they thought they learned more about oil spills using the RIP process learning style compared to just reading about and discussing the topic.
Observed frequencies (Number of Students) for kindergarteners reporting that they “learned more about oil spills using the Research Investigation Process” (RIP Inquiry) than by “reading books and discussing the subject” (Read Books & Discuss) following their participation in the oil spill investigation. |
||||||
|
||||||
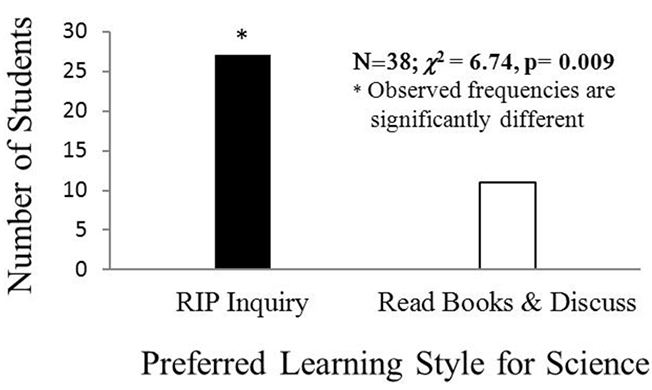
Figure 14. Significantly more Year 1 and 2 Grade K oil spill students indicated that they preferred to learn about science by doing the RIP than by reading books and discussing them.
Observed frequencies (Number of Students) for kindergarteners reporting preference for learning science through “a hands-on investigation (such as the oil spill experiment)” (Inquiry) or by “reading books and discussing them” (Read Books & Discuss) following their participation in the oil spill investigation. |
||||||
|
||||||
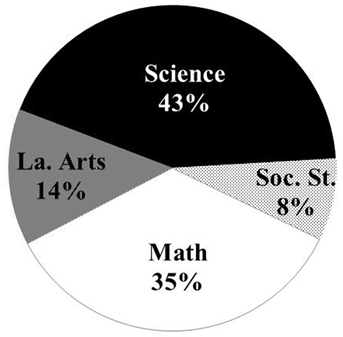
Figure 15. After learning through the RIP, 43% of the Grade K students at Anuenue School (Honolulu, HI) preferred science over social studies, mathematics, and language arts by the end of the year.
Anuenue School Grade K student responses to End-of-Year Assessment Questionnaire item: “Which one-science, social studies, math, or language arts- is your favorite?” N = 37 (ANOVA Science Education Corp., 2011). |
||||||
|
||||||
Figure 16. By the end of the school year after learning through the RIP, the number of Grades K and 1 Kaimuki Complex (Honolulu, HI) students reporting feeling proud of their work more than doubled.
Percent of Kaimuki Complex Grades K and 1 students reporting feeling proud of their scientific inquiry work before (Pre) and at the end of the year following RIP-implementation (Post). (External evaluation; adapted from Wang, 2009.)
|
||||||
|
||||||
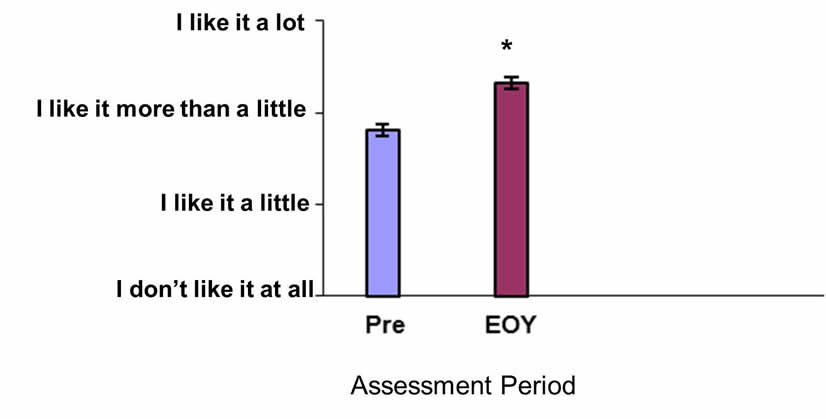
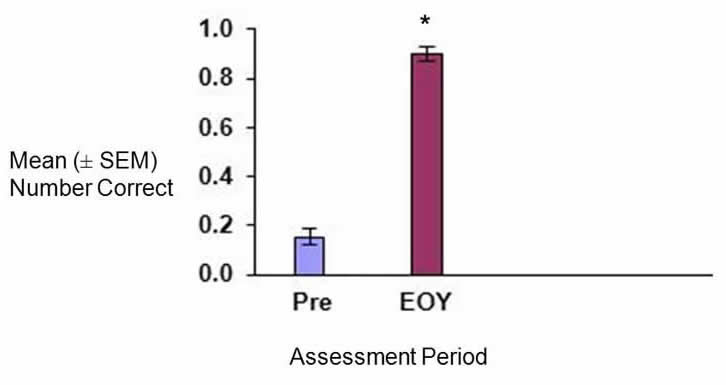
Figure 17. The Grade 7 oil spill students' liking to learn about science as a subject in school increased significantly by the end of the year compared to their pre-RIP implementation levels.
Grade 7 oil spill student responses to: “How much do you like to learn about science as a subject in school?” (“Pre” = pre-RIP implementation, “EOY” = end of year.) N=111.
F(1, 110)=101, P< 0.001 * EOY mean significantly higher than Pre-implementation mean
|
||||||
|
||||||
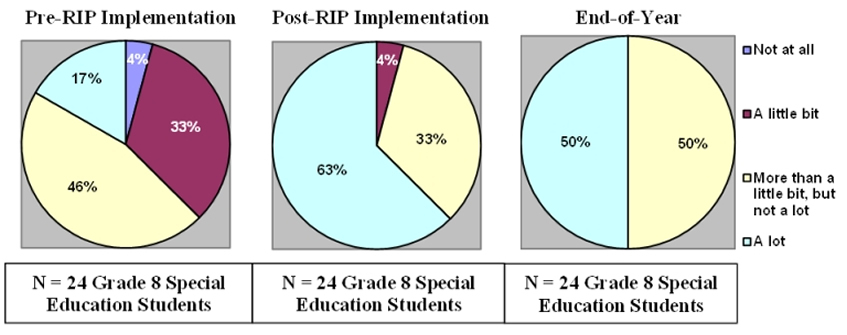
Figure 18 . The percentage of middle school Special Education students who like to learn about science increased dramatically over time. By the end of the year, all of these students liked science, with half of them liking it “a lot.” "All of the evidence from last year and this year point to the RIP program being especially beneficial for learning in this special population of students." (Source: External evaluation; Pergolizzi, 2008).
Special Education Grade 8 student responses to"How much do you like science?” before (Pre-RIP Implementation), after (Post-RIP Implementation) learning through the RIP model, and at the end of the school year (End-of-Year). |
||||||
|
||||||
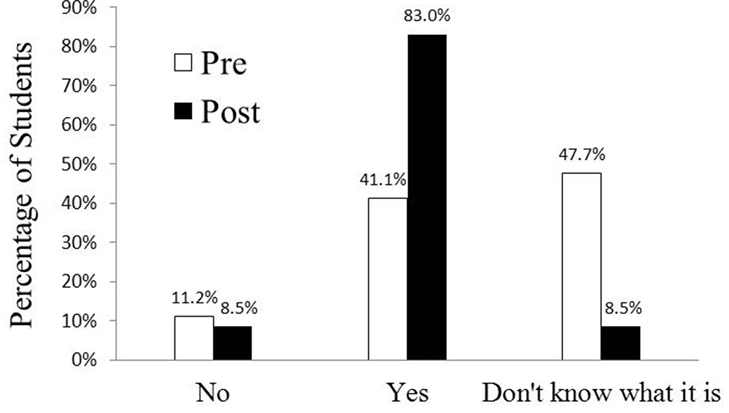
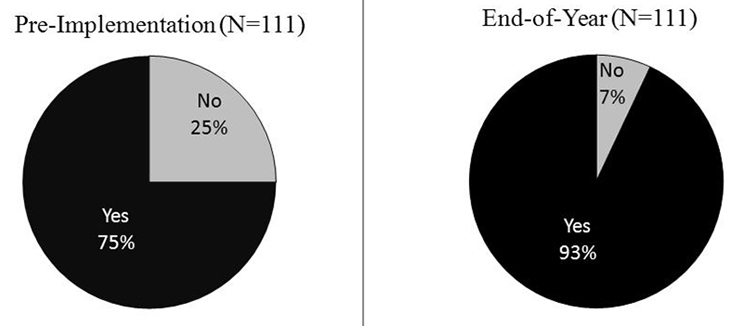
Figure 19. About 25% (28) of the Grade 7 oil spill students initially (Pre-RIP implementation) claimed that they did not desire to learn more science in school (Figure 19). At the end of the year, this number had decreased to only 7% (8 students).
Grade 7 oil spill student RIP Pre-Implementation and End-of-Year Assessment Questionnaire responses to: “Would you like to learn more about science in school?” |
||||||
|
||||||
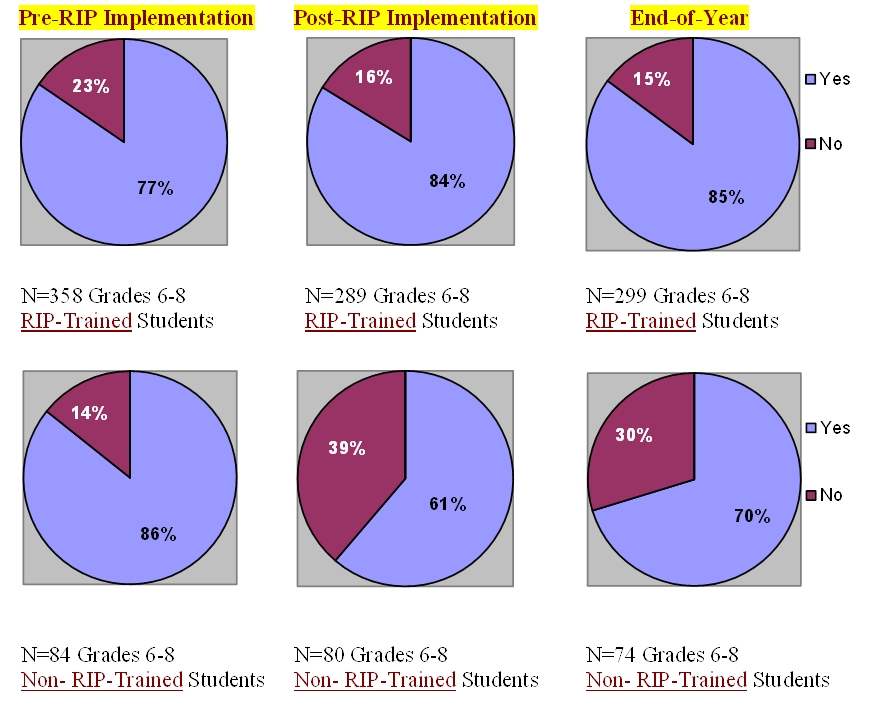
Figure 20. RIP-Trained middle school students (top) retained their interest in learning more about science throughout the year than did Non-RIP trained middle school students (bottom). More RIP-trained students wanted to learn more about science, while fewer Non-RIP-trained students wanted to learn science by the end of the year. This is especially impressive and intriguing because the participating teachers consistently reported that bringing scientific inquiry into classroom instruction posed numerous challenges for their students, especially because of the rigorous demands and expectations regarding thinking, decision-making, and assuming responsibility for one’s own learning. (Source: External evaluation; Pergolizzi, 2008.) Middle School Grade 6-8 RIP Versus NON-RIP Student Responses to “Would you like to learn more about science in school?” |
||||||
|
||||||
|
Table 1. Sample representative End-of-Year Grade 7 oil spill student quotes stating the reasons for their “yes” and “no” responses to: “Would you like to learn more about science in school?” (Figure 19) and degree to which they liked science as a subject compared with their other subjects before and after RIP implementation (before -> after).
|
||||||
|
||||||
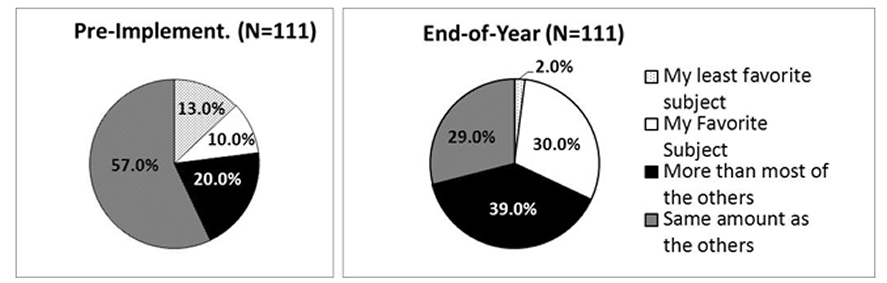
Figure 21. There was substantial change in Ms. Miller’s students’ preferences for science over other subjects in school over the RIP implementation year. At the beginning of the year before RIP implementation, the majority (70%) of the Grade 7 oil spill students liked science the same or less than mathematics, social studies, and language arts. In contrast, the End-of-Year Assessment revealed the majority (69%) of students liking science more than the other subjects. Of these, 30% (33 students) claimed science to be their favorite subject (a 3-fold increase). Only 2% reported science to be their least favorite subject.
Grade 7 oil spill student RIP Pre-Implementation and End-of-Year Implementation Assessment Questionnaire responses to: “Compared to the subjects: math, social studies, and language arts, how much do you like to learn about science?” |
||||||
|
||||||
|
||||||
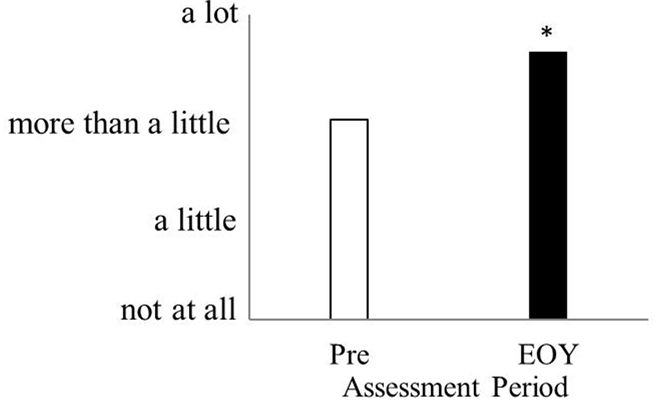
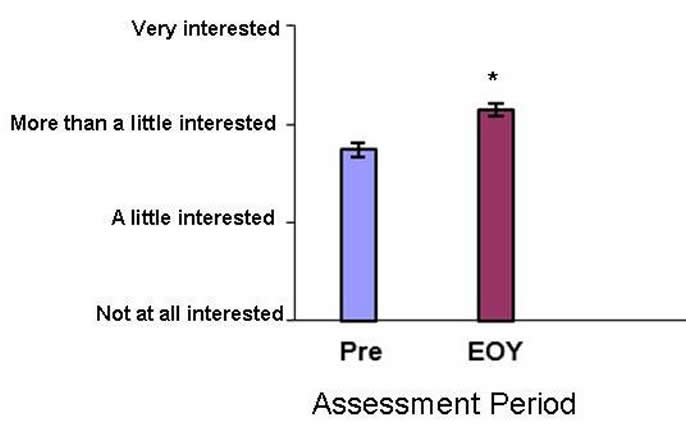
Figure 23. Students indicated that they preferred to learn by using the STEM practices (scientific and engineering practices) and the RIP scientific inquiry model. The RIP emphasizes using a variety of sources for information, and de-emphasizes the use of textbooks as the primary or sole source for information to be learned. Students learn standards-based content through the research investigations they conduct. This is an extremely student-centered program that places students into the very active role of determining what will be studied and the way in which it will be studied. It is interesting to examine whether students enjoy this type of learning and the impact this approach might have on their view about traditional ways of learning. Figure 23 presents the degree to which the Grade 7 oil spill students indicated they like to learn science through the conducting of scientific investigations. Students liked to learn science through conducting investigations only “a little” to “more than a little” pre-RIP implementation. However, at the end of the year, they liked learning science through investigations “more than a little” to “a lot”
Grade 7 oil spill students' responses to: “How much do you like to do scientific investigations (research investigations or scientific inquiry) to learn about science in school?” prior to RIP-implementation (Pre) and at the end of the year (EOY). This assessment item required students to place a vertical line on a horizontal scale with anchor text to indicate their responses. The data were then measured in mm and means computed and compared. N=111 students. One-way repeated measures ANOVA: F (1, 110)=81.21, P<0.001 *Mean End-of-Year (EOY) Assessment value significantly different than the mean Pre- Assessment value.
|
||||||
|
||||||
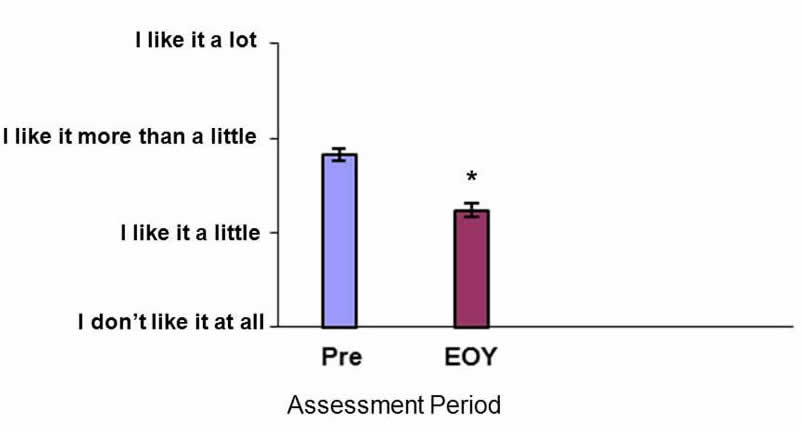
Figure 24. The introduction of the RIP appears to influence student attitudes towards popularity of learning science through traditional methods such as by reading textbooks, doing labs, and attending to teacher lectures. By the end of the year, there was a statistically significant change in the Grade 7 oil spill students' opinions about learning this way. Students lowered their opinion of learning through these methods, indicating that they were becoming accustomed to the RIP method of learning and maybe even preferring it.
Grade 7 oil spill students' responses to: “How much do you like to read books, follow a procedure or activity that is given in the textbook, and listen to your teacher talk to learn about science in school?”This assessment item required students to place a vertical line on a horizontal scale with anchor text to indicate their responses. The data were then measured in mm and means computed and compared. N=111 students. One-way repeated measures ANOVA: F(1, 110)=73.09, P<0.001.
|
||||||
|
||||||
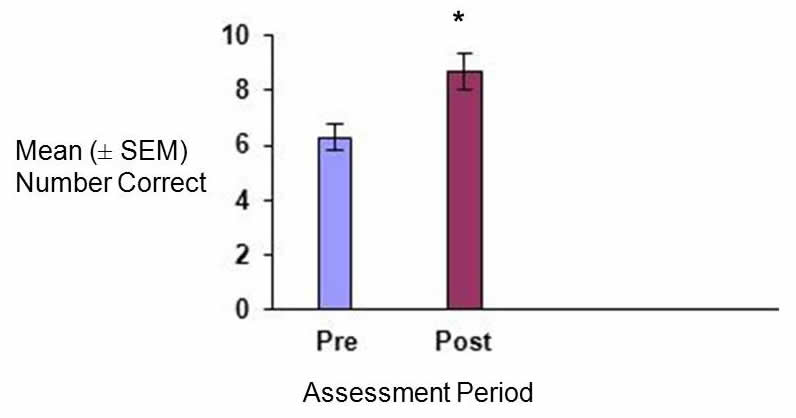
Figure 25. The Grade K oil spill students exhibited more than a 25%, statistically-significant increase in understanding the process of scientific inquiry following implementation of guided inquiry using the RIP.
Grade K oil spill student demonstrated knowledge and understanding of the components of the scientific inquiry process and how to use mathematics skills to make decisions in science before (Pre-) and immediately following (Post-) RIP implementation. N=19 students. Total points: 10. Paired t-test: t(df=18)=3.14, P=0.006.
*Mean Post-Assessment score significantly greater than the mean Pre-Assessment score.
|
||||||
|
||||||
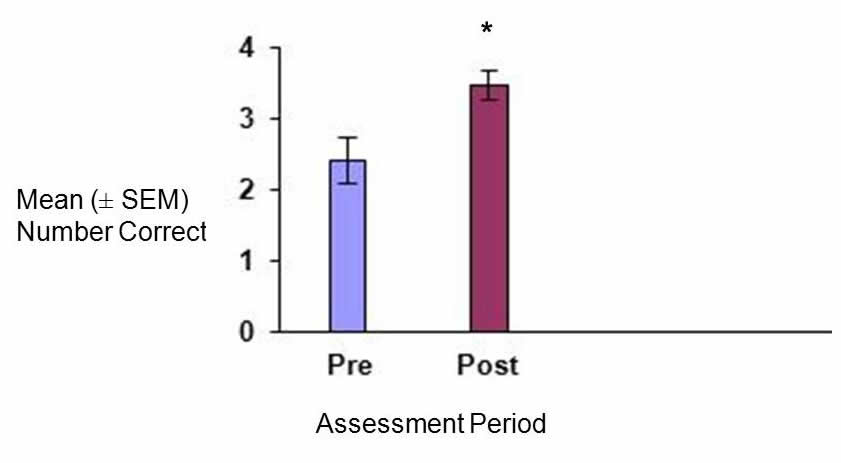
Figure 26. Following RIP implementation, the Grade K oil spill students demonstrated a significant increase in their ability to understand and apply mathematical concepts and tools for making decisions in science.
Grade K oil spill student demonstrated ability to interpret a bar graph and use a median to interpret data and make a decision in science before (Pre-) and immediately following (Post-) RIP implementation. N=19 students. Total points: 4. Paired t-test: t(df=18)=3.14, P=0.006.
*Mean Post-Assessment score significantly greater than the mean Pre-Assessment score.
|
||||||
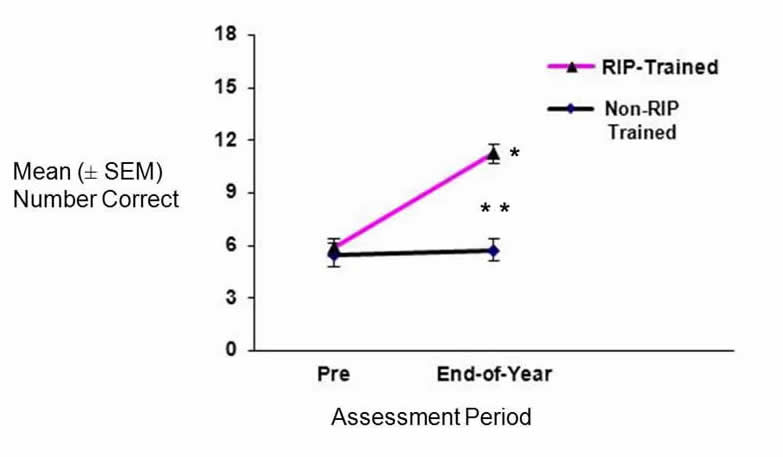
| Figure 27. At the end of their first year of experience using the RIP to learn, Grade K students exhibited a significant increase in their knowledge and understanding of the components and process of scientific inquiry. These RIP-Trained students also exhibited significantly greater inquiry knowledge and skills compared with non-RIP-Trained control students by the end of the year. [Source: External evaluation; Pergolizzi, 2008.]
Knowledge of the scientific inquiry components and process for RIP-trained (n=31) and non-RIP-trained control (n=20) kindergarten students at the start of the school year prior to any science being introduced into the classroom (Pre) and at the end of the school year (End-of-Year)."The two-way ANOVA on scientific inquiry knowledge revealed a statistically significant RIP TRAINING X ASSESSMENT PERIOD interaction effect indicating that the RIP and NON-RIP trained kindergartners’ demonstrated knowledge level differed depending upon assessments. RIP-Trained students exhibited a statistically significant increase in performance on their End-of-Year Assessment compared to the beginning of the year, while there was no difference in performance for the Non-RIP-trained students over this period. At the end of the year, the RIP-Trained students exhibited significantly greater knowledge of the components and process of scientific inquiry than the non-trained students" (Pergolizzi, 2008).
Two Way ANOVA with repeated measures on one factor (assessment period): RIP Training (RIP-Trained VS Non-RIP Trained Control: F(1, 49) = 27.12, p<0.0001 Assessment Period (Pre VS End-of-Year): F(1, 49) = 23.03, p<0.0001 RIP Training X Assessment Period (interaction): F(1, 49) =18.4, p<0.0001 Holm-Sidak multiple comparisons for Interaction Effect: RIP-Trained: Pre VS End-of-Year: t=7.2560, p<0.0001 Non-RIP Trained: Pre VS End-of-Year: t=0.357, p>0.05 End-of-Year RIP-Trained VS End-of-Year Non-RIP Trained: t=6.701, p<0.0001 Pre Non-RIP-trained VS Pre RIP-Trained: t=.515, p>0.05 Statistically-significant differences: * RIP-Trained Pre mean differs from RIP-Trained End-of-Year mean ** RIP-Trained End-of-Year mean differs from Non-RIP-Trained End-of-Year mean |
||||||
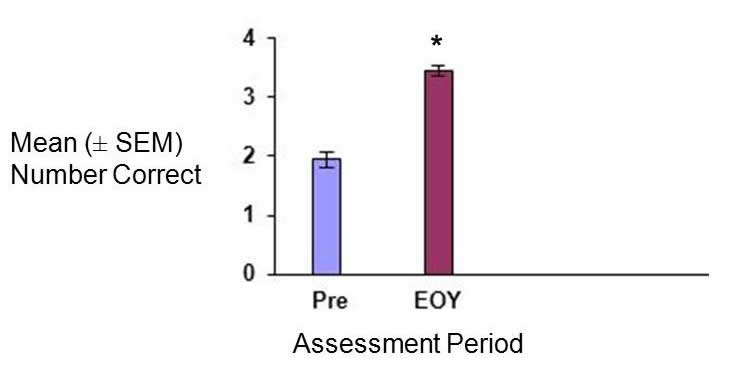
Figure 28. At the end of the RIP implementation year, the Grade 7 oil spill students exhibited a significant increase in their knowledge and understanding of the scientific inquiry components that compose the Introduction section of the RIP.
Grade 7 oil spill student demonstrated knowledge and understanding of the introduction components of RIP scientific inquiry (including observation, research question, background information, and hypothesis) before (Pre) RIP Implementation and at the end of the year (EOY). N=111 students. Total points: 4.
One-way repeated measures ANOVA: F(1, 110)=119.67, P<0.001.
*Mean End-of-Year Assessment score significantly greater than the mean Pre-Assessment score. |
||||||
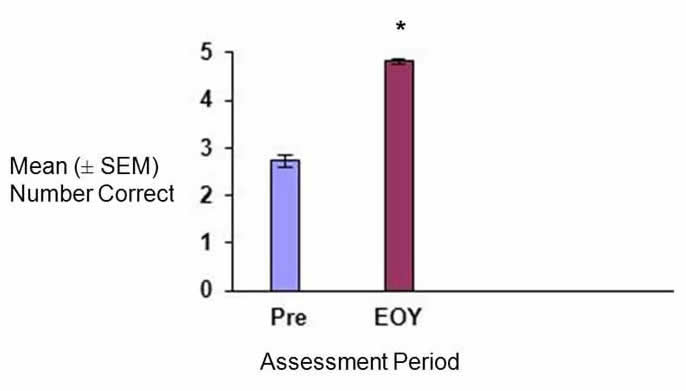
| Figure 29. At the end of the RIP implementation year, the Grade 7 oil spill students exhibited a significant increase in their knowledge and understanding of the scientific inquiry components that compose the post-introductory section of the RIP.
Grade 7 oil spill student demonstrated knowledge of the post-introduction components of RIP scientific inquiry (including method, results, discussion and conclusions, and Next Step) before (Pre) RIP Implementation and at the end of the year (EOY). N=111 students. Total points: 5.
One-way repeated measures ANOVA: F(2, 110)=266.71, P<0.001.
*Mean End-of-Year Assessment score significantly greater than the Pre-Assessment score. |
||||||
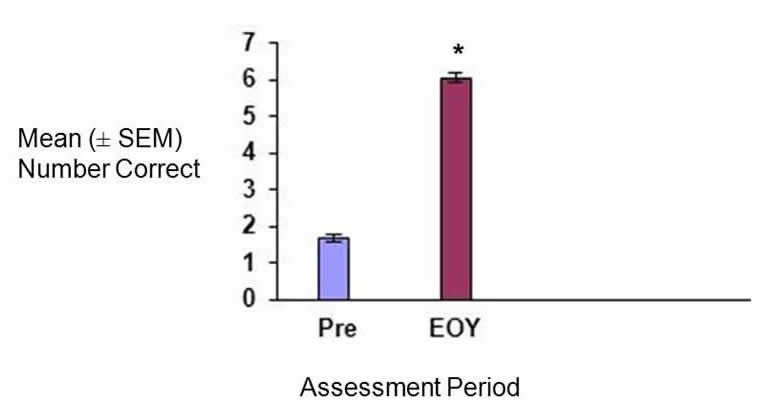
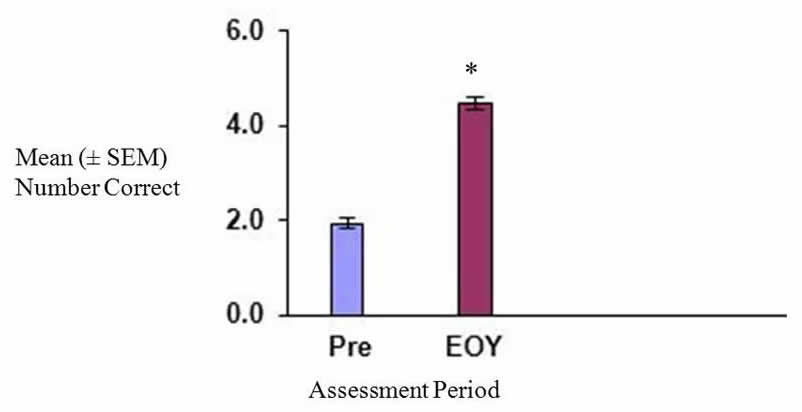
Figure 30. Grade 7 oil spill students showed dramatic gains in their knowledge and understanding of the scientific inquiry process. By the End-of-Year assessment, the student mean score for knowing the logical order of the components was four-fold higher, and statistically different from the Pre-implementation mean score.
Grade 7 oil spill student demonstrated knowledge of the order of the components of the RIP scientific inquiry process before (Pre) RIP Implementation and at the end of the year (EOY). N=111 students. Total points: 7.
One-way repeated measures ANOVA: F(1, 110)=782.55, P<0.001.
*Mean End-of-Year Assessment score significantly greater than the mean Pre-Assessment score.
|
||||||
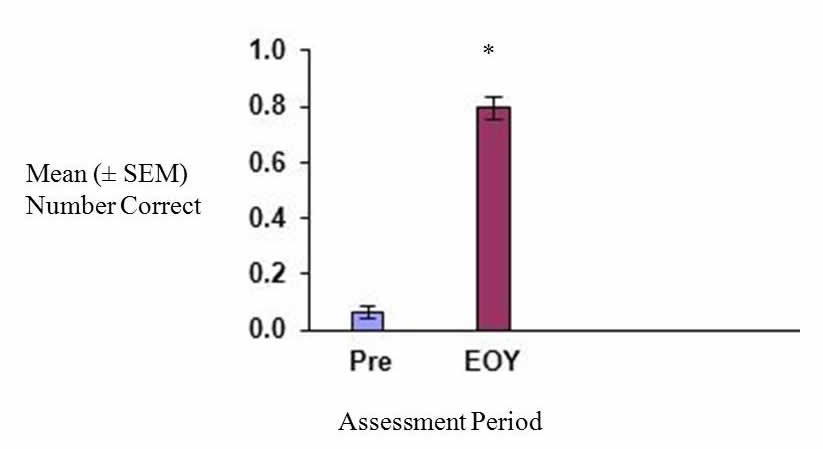
Figure 31. Grade 7 oil spill students improved significantly in their ability to recognize a complete and testable RIP hypothesis by the end of the RIP-implementation year.
Grade 7oil spill student demonstrated ability to recognize a complete, testable hypothesis before (Pre) RIP Implementation and at the end of the year (EOY). N=111students. Total points: 1.
One-way repeated measures ANOVA: F(1, 110)=326.07, P<0.001.
*Mean End-of-Year Assessment score significantly higher than the mean Pre-Assessment score. |
||||||
Figure 32. Grade 7 oil spill student understanding of the concept of mathematical uncertainty (or error) and the ability to apply this in decision making was significantly higher at the end of the RIP implementation year.
Grade 7 oil spill student demonstrated ability to recognize the importance of error and apply this to drawing conclusions from data before (Pre) RIP Implementation and at the end of the year (EOY). N=111 students. Total points: 1.
One-way repeated measures ANOVA: F(1, 110)=251.12, P>0.001.
*Mean End-of-Year Assessment score significantly higher than the mean Pre-Assessment score. |
||||||
Figure 33. Understanding the design aspects of a scientific investigation is very challenging for both teachers and students, but also very important for successful development and implementation of inquiry-based curriculum and instruction.The scientific inquiry content portion of the assessment also included items related to designing scientific investigations, such as understanding variables and control groups. One series of items required responding to the detailed description of scientific investigations. The Grade 7 oil spill students were asked to analyze the described study in terms of variables, control groups, and type of study it was. Another item briefly described an investigation and requested that students critique the method section. The data for these combined items resulted in a statistically significant increase in student knowledge and ability by the end of the year.
Grade 7 oil spill student demonstrated ability to recognize the variables in an experiment, understand research design concepts, and critically analyze the methodology of a scientific investigation before (Pre) RIP Implementation and at the end of the year (EOY). N=111 students. Total points: 6. One-way repeated measures ANOVA: F(1, 110)=365.58, P<0.001. *Mean End-of-Year Assessment score significantly higher than the mean Pre-Assessment score.
|
||||||
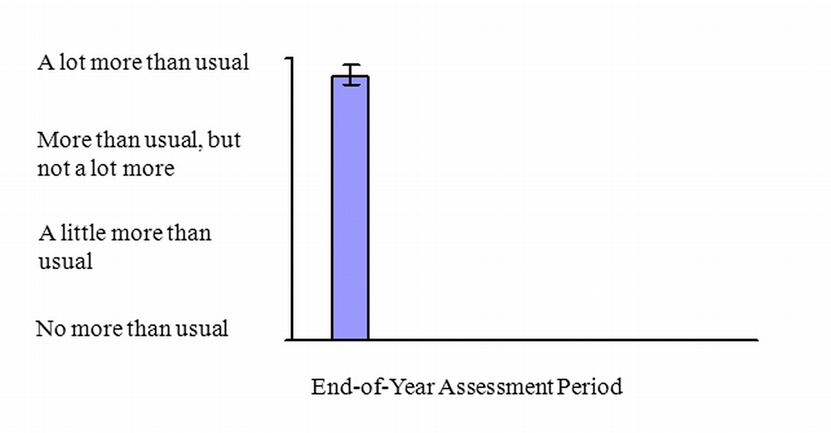
Figure 34. Grade 7 oil spill students' opinions regarding the thinking demands and motivation to think related to scientific inquiry-based learning. The students reported that the RIP encouraged them to think "a lot more than usual."
Grade 7 oil spill student End-of-Year Assessment responses to“The scientific inquiry process encourages me to think _____________while learning science.” N=111 |
||||||
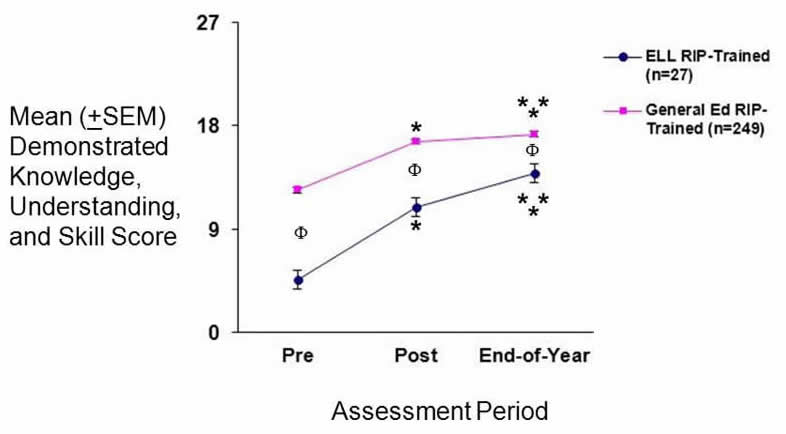
Figure 35. "The General Education students started the year with a large advantage in knowledge and skills related to scientific inquiry, more than doubling the performance of the ELL students. Both groups exhibited statistically-significant increases in scientific inquiry knowledge and skills immediately following implementation of the RIP into the classroom, and further significant increases at the end of the year. However, the gain in knowledge and skills exhibited by the ELL students was substantially greater than that for the General Education students, more than doubling after implementation and increasing by 300% at the end of the year (at which time the difference in the performance of the two groups was almost eliminated)" [Source: External evaluation; Pergolizzi, 2008].
Grade 8 RIP-Trained ELL and General Education students’ scientific inquiry knowledge, understanding, and skills at the beginning of the year before any science was taught (Pre), after implementation of the RIP (Post), and at the end of the year (End-of-Year).
Two Way ANOVA with repeated measures on one factor (assessment period): Education Group (ELL-RIP Trained VS General Ed.-RIP Trained): F(1, 274) = 53.71, p<0.001 Assessment Period (Pre VS End-of-Year): F(2, 425) = 78.37, p<0.001 RIP Training X Assessment Period (interaction): F(2, 425) =6.744, p=0.001
significant differences: * ELL-RIP-Trained: Post and End-of-Year means differ from Pre mean * General Education RIP-Trained: Post and End-of-Year means differ from Pre mean ** ELL-RIP-Trained: End-of-Year mean differs from Post mean ** General Ed.-RIP-Trained End-of-Year mean differs from Post mean Φ ELL-RIP-Trained differs from General Ed.-RIP Trained: at Pre, Post, and End-of-Year
significant Holm-Sidak multiple comparisons for Interaction Effect: ELL-RIP Trained: Post differs from Pre: t=5.715, p<0.0001; End-of-Year differs from Pre: t=8.134, p<0.0001 End-of-Year differs from Post: t=2.617, p<0.009 General Ed.-RIP Trained: Post differs from Pre: t=13.26, p<0.0001; End-of-Year differs from Pre: t=15.21, p<0.0001 End-of-Year differs from Post: t=2.11, p=0.036 General Ed.-RIP Trained differs from ELL-RIP-Trained: Pre: t=6.98, p<0.0001 Post: t=5.10, p<0.0001 End-of-Year: t=2.83, p<0.005 |
||||||
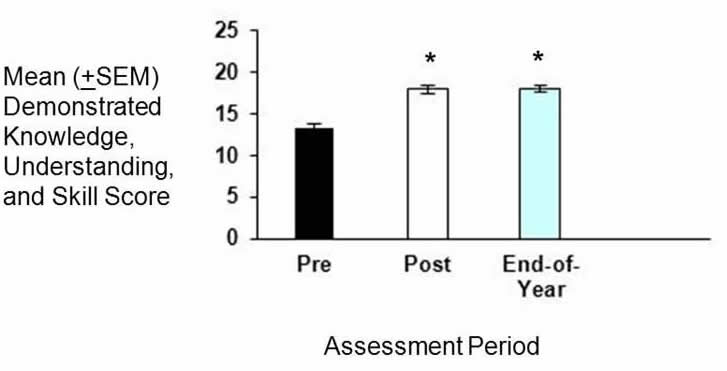
Figure 36. Grade 8-Special Education Students. "The eighth grade Special Education students’ scientific inquiry content data were analyzed to determine the impact of the RIP program on their ability to perform well on the knowledge and skill assessment items...These students made statistically significant gains in their knowledge and understanding of the scientific inquiry components and process immediately following implementation of the RIP program into the classroom that were still present at the end of the year. This finding complements the fact that these students are enjoying learning science with this program [already discussed above; see Figure 18]. It is clear that these highly-challenged students are not only learning science, but also are enjoying learning it!" (Source: External evaluation; Pergolizzi, 2008).
RIP-Trained eighth grade Special Education students’ demonstrated knowledge/understanding of the scientific inquiry components, process, and thinking and thinking skills before RIP implementation into the classroom (Pre), after implementation into the classroom (Post), and at the end of the year (End-of-Year). Total Points: 25
The data were analyzed with a one-way repeated measures ANOVA: F (2, 46) =660.37, p<0.0001
*significantly different from Pre-Assessment Period mean Statistically significant Holm-Sidak Multiple Comparisons: Post VS Pre: t= 31.188, p< 0.002 -29 End-of Year VS Pre: t= 31.75, p< 0.007 -31
|
||||||
|
||||||
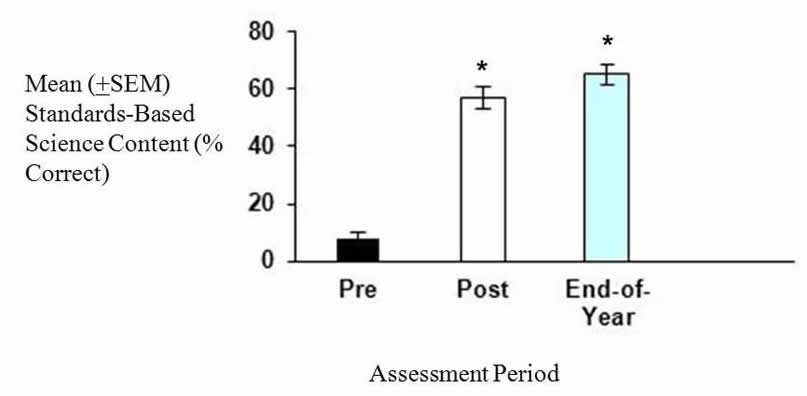
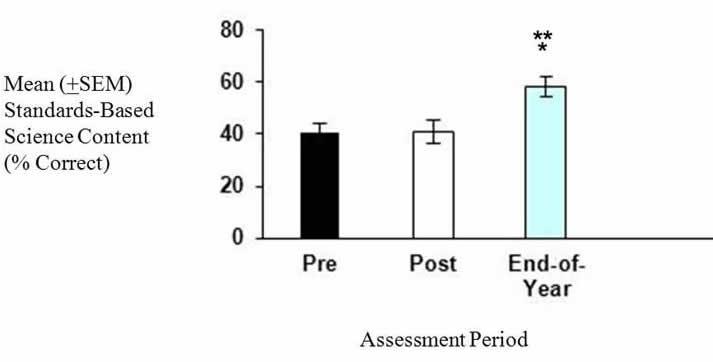
Comment referring to Figures 37 to 39 Below (Source: External evaluation; Pergolizzi, 2008):
"The Grade 6-8 student performance on the non-science content items covered through the scientific inquiry process again illustrates that students are able to learn science content through the RIP method of science instruction quite well." As can be seen in Figures 37 through 39, "These middle school students displayed statistically significant increases in their knowledge and understanding of standards-based science content above and beyond the process when taught science through this instructional approach." |
||||||
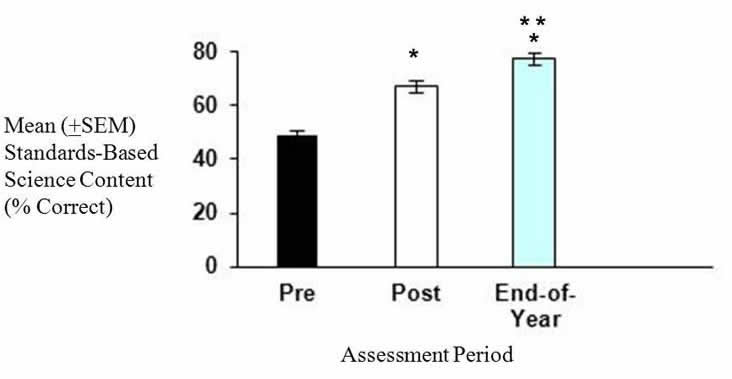
Figure 37. Grade 6 RIP-Trained students’ ability to learn non-inquiry science standards-based content. The students demonstrated that they were able to learn science content through the RIP and still retain this knowledge by the end of the year. (Source: External evaluation; Pergolizzi, 2008.)
Grade 6 RIP-Trained students’ demonstrated knowledge/understanding of non-inquiry science standards-based content before RIP implementation into the classroom (Pre, n=69), after implementation into the classroom (Post, n=70), and at the end of the year (End-of-Year, n=65). This section contained 5 items and was scored as percent of total correct. The Grade 6 RIP-trained teachers introduced their own non-scientific inquiry science items. (The non-scientific inquiry science content was incorporated in the RIP-based scientific inquiry instructional strategy during the RIP implementation period.) The non-scientific inquiry science content was incorporated in the RIP-based scientific inquiry instructional strategy during the RIP implementation period.
The data were analyzed with a one-way repeated measures ANOVA: F (2, 130) =146.74, p<0.0001.
*significantly different from Pre-Implementation Assessment mean
Statistically significant Holm-Sidak Multiple Comparisons: Pre VS Post: t= 14.03, p< 0.009 -25 Pre VS End-of-Year: t= 15.48, p< 0.003 -28
|
||||||
Figure 38. Grade 7 RIP-Trained students’ demonstrated a significant increase in knowledge/understanding of non-inquiry science standards-based content at the end of the year after learning through the RIP. (Source: External evaluation; Pergolizzi, 2008.)
Grade 7 RIP-Trained students’ demonstrated knowledge/understanding of non-inquiry science standards-based content before RIP implementation into the classroom (Pre, n=43), after implementation into the classroom (Post, n=47), and at the end of the year (End-of-Year, n=47). This section contained 5 items and was scored as percent of total correct. The Grade 7 RIP-trained teachers introduced their own non-scientific inquiry science items. (The non-scientific inquiry science content was incorporated in the RIP-based scientific inquiry instructional strategy during the RIP implementation period.)
The data were analyzed with a one-way repeated measures ANOVA: F (2, 81) = 7.39, p<0.009.
* different from Pre-Implementation Assessment mean ** different from Post-Implementation Assessment mean
Holm-Sidak Multiple Comparisons: Pre VS End-of-Year: t= 3.42, p< 0.001 Post VS End-of-Year: t= 3.13, p< 0.003 |
||||||
Figure 39. Grade 8 RIP-Trained students’ ability to learn non-inquiry science standards-based content. The students demonstrated that they were able to learn science content through the RIP and still retain this knowledge by the end of the year. [Source: External evaluation; Pergolizzi, 2008.]
Grade 8 RIP-Trained students’ demonstrated knowledge/understanding of non-inquiry science standards-based content before RIP implementation into the classroom (Pre, n=174), after implementation into the classroom (Post, n=177), and at the end of the year (End-of-Year, n=173). This section contained 5 items and was scored as percent of total correct. The Grade 8 RIP-trained teachers introduced their own non-scientific inquiry science items. (The non-scientific inquiry science content was incorporated in the RIP-based scientific inquiry instructional strategy during the RIP implementation period.) The data were analyzed with a one-way repeated measures ANOVA: F (2, 7) = 107.19, p<0.0001.
*significantly different from Pre-Implementation Assessment mean **significantly different from Post-Implementation Assessment mean Statistically significant Holm-Sidak Multiple Comparisons: Pre VS Post: t= 9.99, p< 0.002 -32 Pre VS End-of-Year: t= 14.09, p< 0.002 -32 Post VS End-of-Year: t= 4.23, p< 0.001 -17 |
||||||
Figure 40. Demonstrated Grade K student non-inquiry science knowledge gained through using the RIP or another non-RIP instructional/learning method. Kindergartners who learned science content through the RIP model performed significantly better on an assessment measuring science knowledge gained than Grade K students who learned science content through other methods of instruction. (Source: External evaluation; Pergolizzi, 2008.)
Kindergarteners’ knowledge of non-inquiry standards-based science content learned through the RIP (RIP-trained) or through another unknown instructional strategy (non-RIP-trained control) at the start of the school year prior to any science being introduced into the classroom (Pre) and at the end of the school year (End-of-Year). This section contained 3 items and was scored as percent of total correct. The Grade K teachers introduced their own non-scientific inquiry science items. Assessment results for knowledge of non-scientific inquiry standards-based science content that was taught through the RIP versus through the control teachers' (non-RIP-trained teachers) other non-specified instructional practices were compared. Each teacher constructed 5 items and the percent correctly answered was calculated and recorded for later analysis.
Two Way ANOVA with repeated measures on one factor (assessment period): RIP Training (RIP-Trained VS Non-RIP Trained Control: F(1, 58) = 2.75, p>0.05 Assessment Period (Pre VS End-of-Year): F(1, 58) = 53.04, p<0.001 RIP Training X Assessment Period (interaction): F(1,58) =5.46, p<0.02
Holm-Sidak multiple comparisons for Interaction Effect: RIP-Trained: Pre VS End-of-Year: t=8.55, p<0.0001 Non-RIP Trained: Pre VS End-of-Year: t=2.99, p=0.004 End-of-Year RIP-Trained VS End-of-Year Non-RIP Trained: t=2.74, p=0.007 Pre Non-RIP-trained VS Pre RIP-Trained: t=0.130, p>0.05 Statistically-significant differences: * RIP-Trained End-of-Year mean differs from RIP-Trained Pre mean * Non-RIP-trained End-of-Year mean differs from Non-RIP-trained Pre mean ** RIP-Trained End-of-Year mean differs from Non-RIP-trained End-of-Year mean
|
||||||
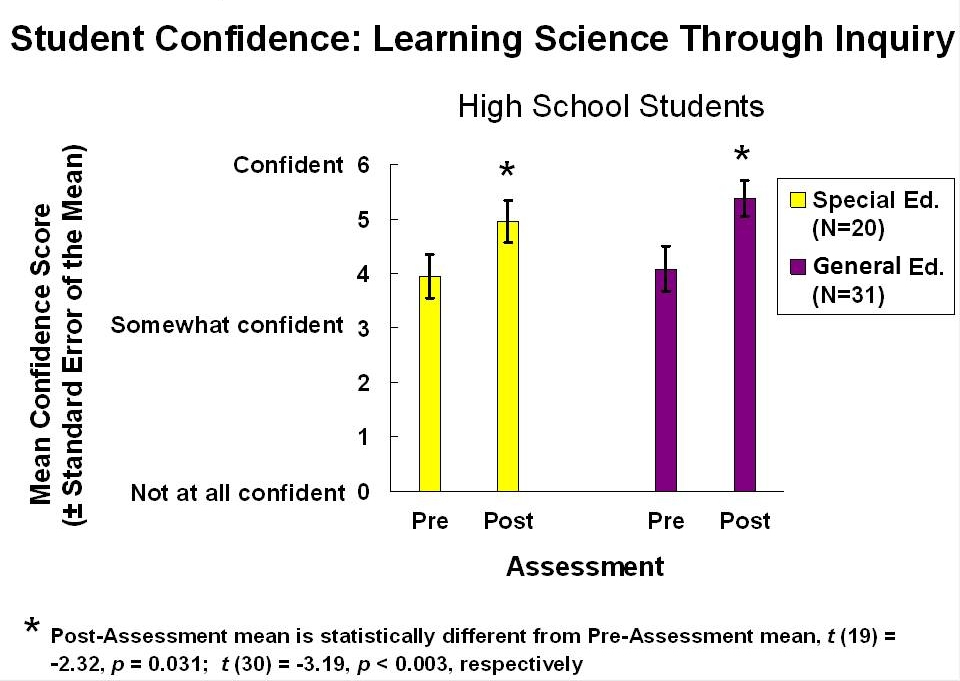
Figure 41. Both Special Education and general education students exhibited equivalent statistically-significant increases in their confidence in their ability to learn science through the RIP scientific inquiry model following RIP-implementation (2004 school-wide RIP-implementation, Halau Lokahi high school; Landsman, 2005b.)
Special Education and general education high school student' self-reported confidence in ability to learn about science through scientific inquiry before (Pre) and after (Post) RIP-implementation.
|
||||||
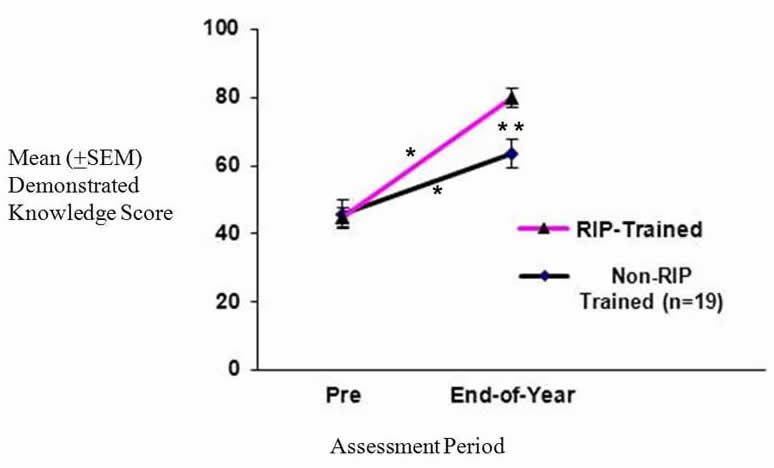
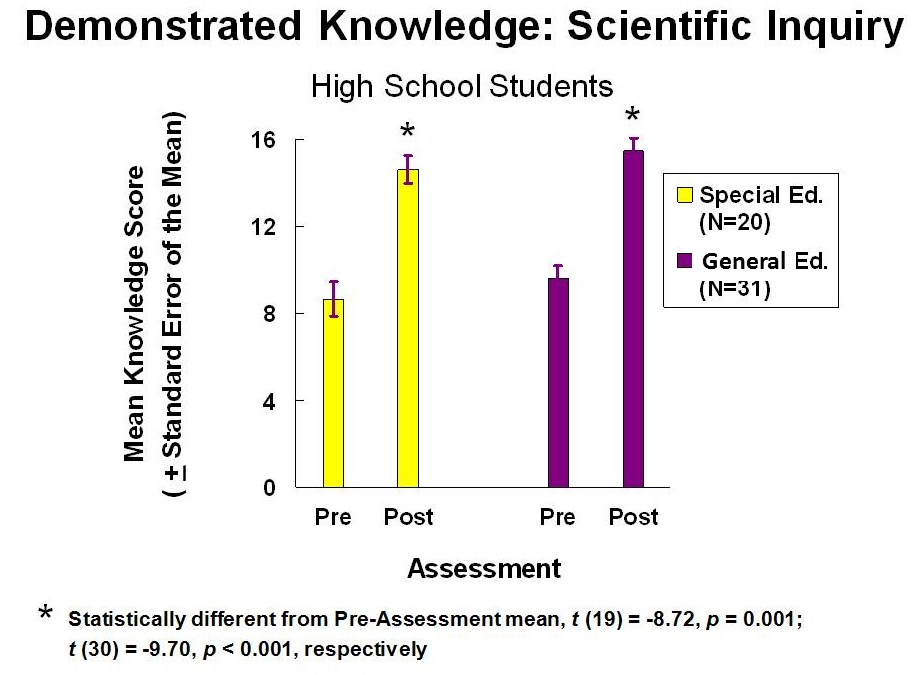
Figure 42. Both Special Education and general education students exhibited equivalent statistically-significant increases in their knowledge of the RIP scientific inquiry process and components following RIP-implementation (2004 school-wide RIP-implementation, Halau Lokahi high school; Landsman, 2005b.)
Special Education and general education high school student' demonstrated knowledge of scientific inquiry before (Pre) and after (Post) RIP-implementation.
|
||||||
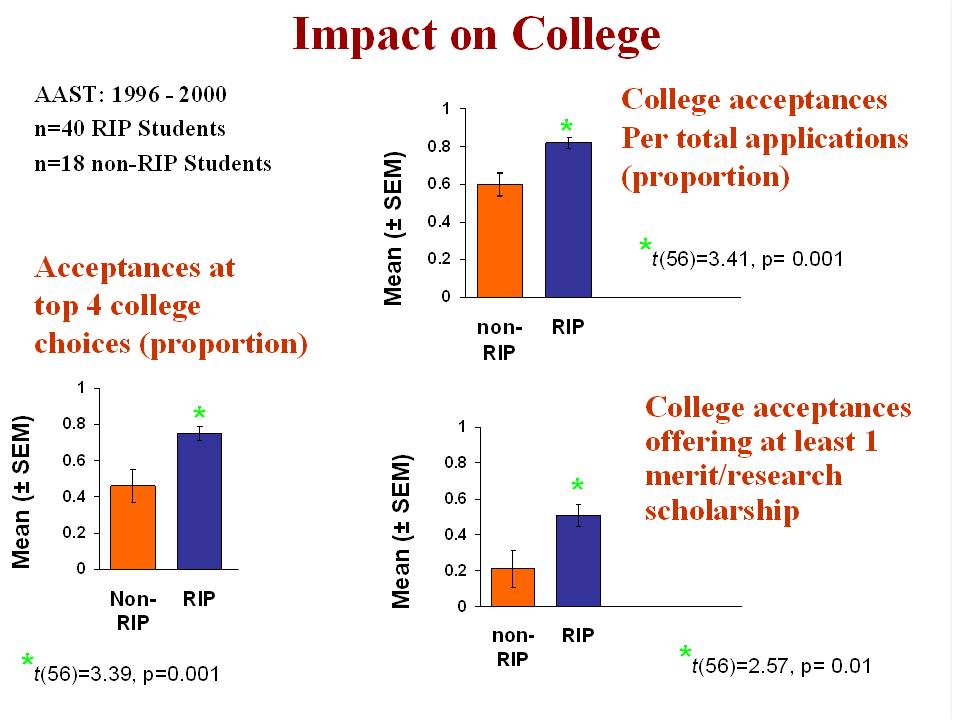
Figure 43. Impact of high school RIP learning experience on college/university acceptances and scholarships. RIP students received significantly more college acceptances per application, more acceptances at their top 4 college choices, and more offers of merit and research scholarships compared to non-RIP students.
Comparison of RIP- and non-RIP-trained high school students from the Academy for the Advancement of Science and Technology (AAST) for college acceptances and scholarships. Students were accepted to AAST (high school) based on their aptitude for STEM fields. Students were surveyed 5 to 9 years following graduation. (Data from AAST, Hackensack, NJ; Landsman, 2005b.) * indicates mean for RIP students is statistically greater than mean for non-RIP students.
|
||||||
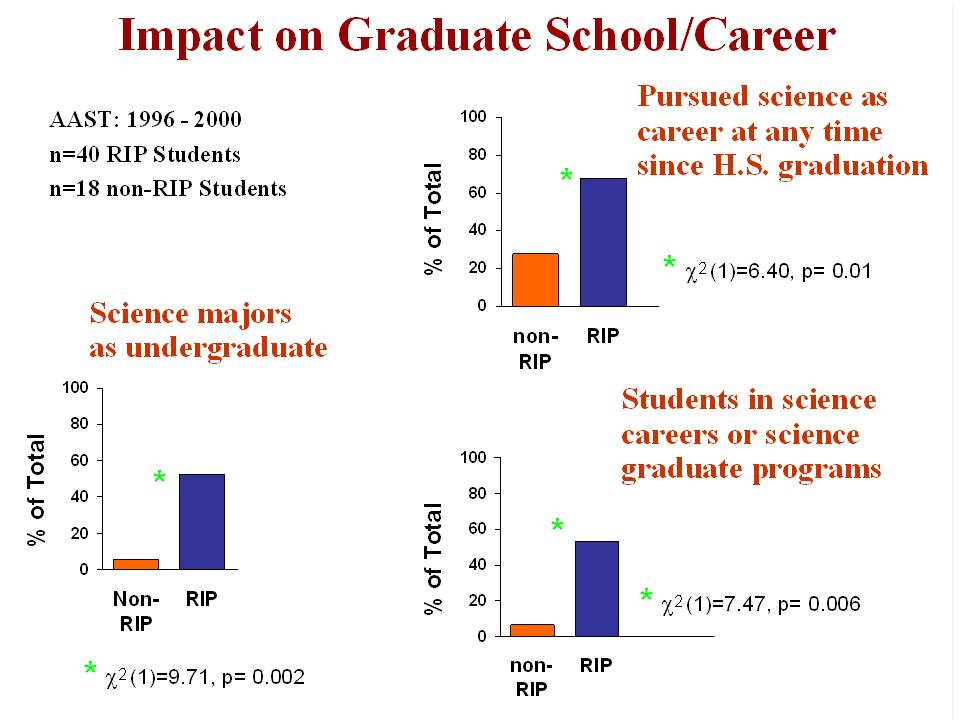
Figure 44. Impact of high school student exposure to learning through the RIP on post high-school science education and science careers. Significantly greater numbers of RIP students compared to non-RIP control students pursued science as undergraduates, as a career at any time since graduation, or were currently in science careers or science graduate programs at the time of the survey.
|
||||||
Comparison of the number (percent of total) of RIP- and non-RIP-trained high school students from the Academy for the Advancement of Science and Technology (AAST) who pursued a science undergraduate or graduate degree, or a science career anytime since high school graduation, and/or who were in a career or graduate program in science at the time of the survey. Students were accepted to AAST (high school) based on their aptitude for STEM fields. Students were surveyed 5 to 9 years following graduation. (Data from AAST, Hackensack, NJ; Landsman, 2005b.) * indicates percent of total RIP students statistically greater than non-RIP students. |
||||||
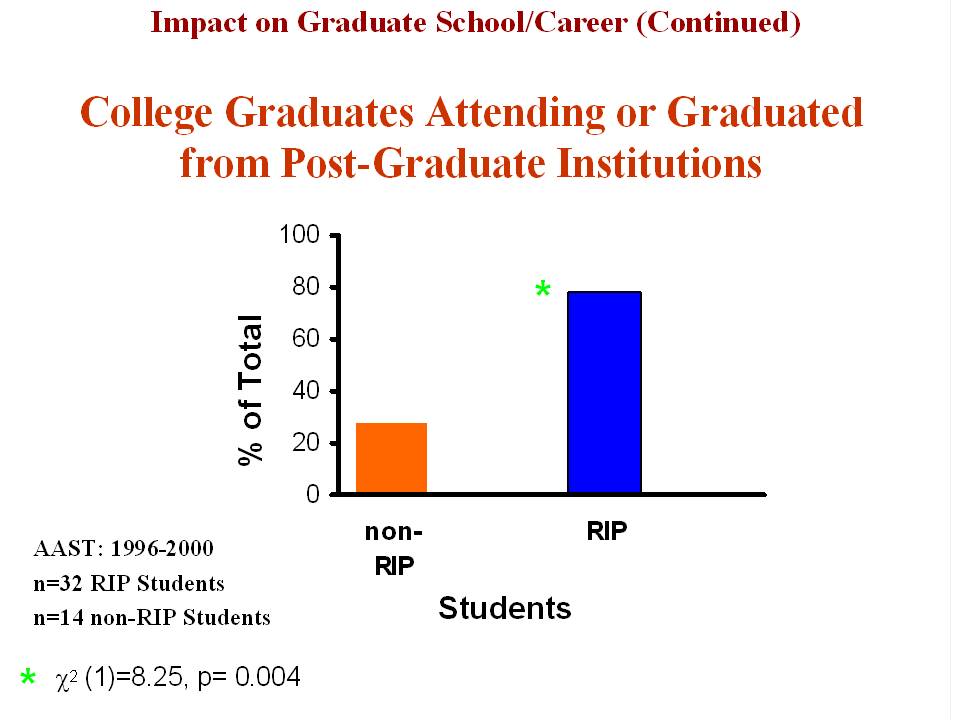
Figure 45. Impact of high school student exposure to learning through the RIP on pursuing graduate school education. Significantly more RIP-trained high school students were attending or had already graduated from post-graduate college and university programs compared to non-RIP-trained control students at the time of the survey.
Comparison of the number (percent of total) of RIP- and non-RIP-trained high school students from the Academy for the Advancement of Science and Technology (AAST) attending or graduated from post-graduate institutions. Students were accepted to AAST based on their aptitude for STEM fields. Students were surveyed 5 to 9 years following graduation. (Data from AAST, Hackensack, NJ; Landsman, 2005b.) * indicates percent of total RIP students statistically greater than non-RIP students.
|
||||||
Sample Teacher RIP Assessment Evaluation Reports (pdf files) Bloomfield, NM 2012 (Mixed Grades K-12) Honolulu District, Honolulu, HI 2003 (Grades K-5-Ms. LoRusso's Training Cadre) |
||||||
|
Table 2. Reflection from oil spill teachers Lori LoRusso and Melissa Miller Grade K (Lori LoRusso) and Grade 7 ( Melissa Miller) teacher reflection (s) from assessments:
K reflection: "I treated scientific inquiry as a thinking process, not just a set of instructions to follow. Throughout the RIP, I challenged my students to think by using Socratic questioning and group discussion. Instead of just giving them step-by-step directions, I led them through the different components of inquiry by teaching strategies like the RIP method of hypothesis construction and skills such as data collection."
Grade 7: "Incorporation of the RIP education model into my classroom has allowed my students to be engaged in their learning, provided them with a thinking tool to be used to make decisions, promoted cooperative learning experiences, fostered in them the ability to think critically, encouraged and resulted in creativity, and provided them with opportunities to share their knowledge of concepts with others."
"I have observed students working well cooperatively with one another. I have also observed allot of critical thinking happening that led them to good questions and answers, whereas before my students would just sit and wait for an answer to be given to them. I was actually able to observe students making decisions for themselves in a constructive and positive way. How wonderful it is to see students questioning and actually researching to find an answer on their own!" |
|||||
| Teacher Quantitative Opinions/Reflection of RIP Instruction Impact on their Students (Figures 46-49) | ||||||
Figure 46. By the end of the first and subsequent years following RIP implementation at their schools, teachers typically report that their participation in the RIP Program led to substantial student application of scientific inquiry. Anuenue School (Honolulu, HI, 2010) teachers’ (n=8) end-of-year responses regarding amount of student application of scientific inquiry for learning for the first (Year 1) and second (Year 2) year post-RIP implementation. The data were analyzed with a paired t-test: t(7) = -2.07, p<0.08.
|
||||||
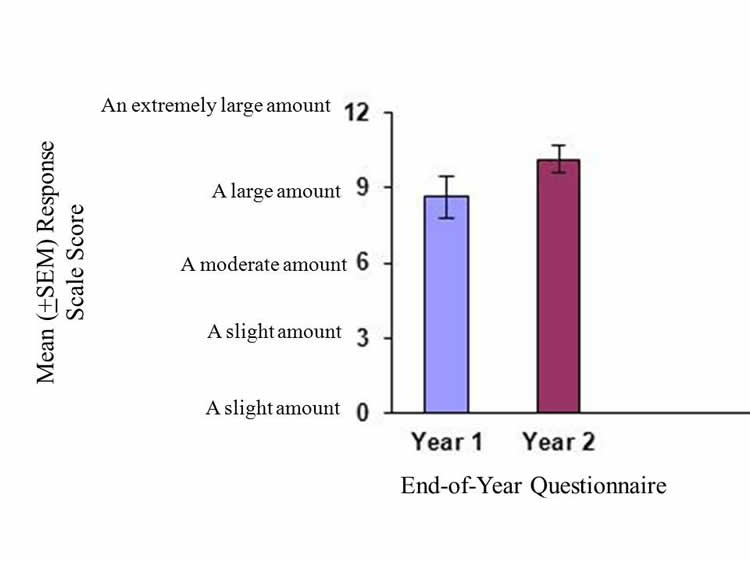
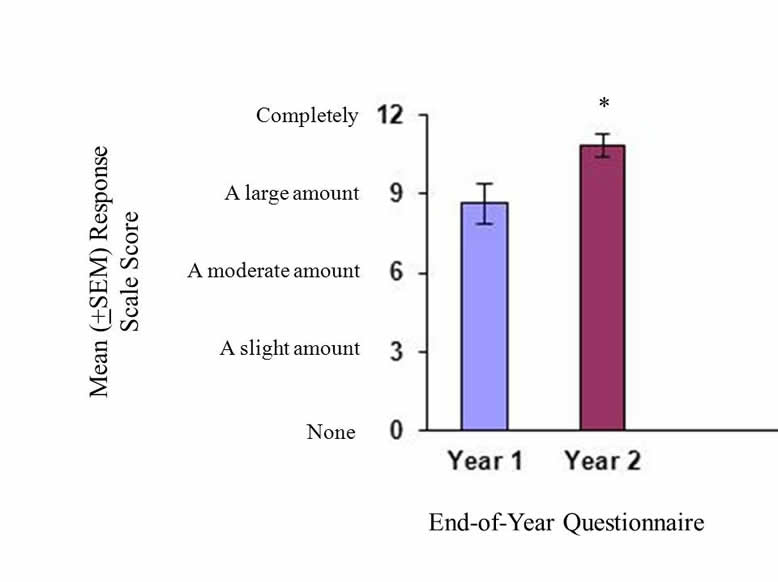
Figure 47. When asked to compare the RIP with their instructional practices used in prior years, teachers reported between “large” and “completely” as the amount to which the RIP positively impacted their students’ ability to learn science and/or other content areas. Compared with their Year 1 perceptions, the Year 2 teacher-perceived RIP impact level on student learning was statistically different and 20% higher than the Year 1 response scale score (Year 1 mean = 8.65 and Year 2 mean = 10.85). Teacher #9 stated that RIP inquiry-based instruction led to “better student understanding and appreciation of science overall.” Teacher #5 wrote, “I noticed that they were more observant of their surroundings and noticed how science is all around them.” (Source: ANOVA Science Education Corp., 2011.)
End-of-Year Questionnaire teacher responses to “Compared to your instructional practices used in previous years, to what extent do you feel that the RIP inquiry-based instruction you used this year positively impacted your students’ ability to learn science (and/or other content areas)?” The response scale included “none” (‘0’-value), “a slight amount” (‘3’-value), “a moderate amount” (‘6’-value), “a large amount” (‘9’-value), and “completely” (‘12’-value). N=8 Anuenue School, Honolulu, HI, teachers. The data were analyzed with a paired t-test: t(7) = -2.60, p<0.04. *Mean Year 2 Questionnaire response value significantly greater than mean Year 1 Questionnaire response value. |
||||||
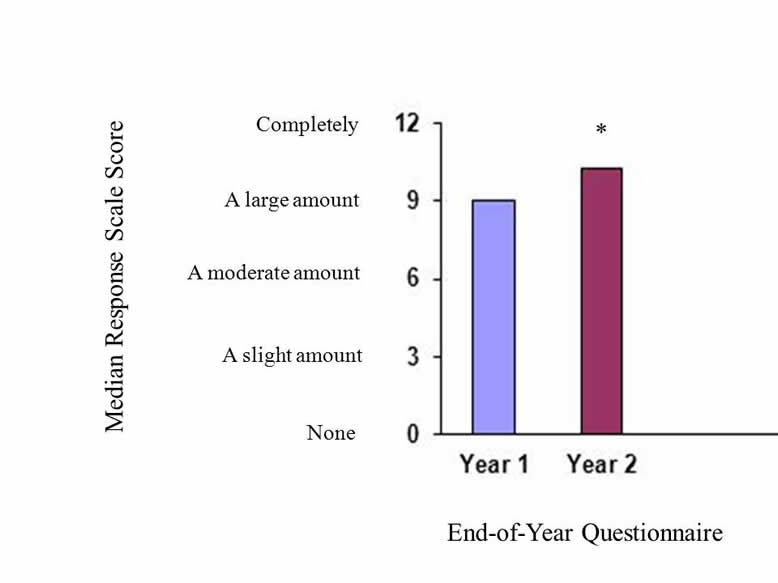
Figure 48. One clear indicator of student motivation and enjoyment in learning science is student attitude towards assessments. Anuenue RIP School Teacher #3 commented, “My students were actually excited when they learned that they would be taking another assessment on science and scientific inquiry at the end of the year. They wanted to show off how much they had learned! When we did our final assessment of the year, my students were enthusiastic and many felt confident in completing the assessment." Compared to former instructional practices they used, teachers consistently indicate that their using the RIP model of instruction more positively impacts student motivation to learn content across subject areas. (Source: ANOVA Science Education Corp., 2011.)
End- End-of-Year Questionnaire teacher responses to “Compared to your instructional practices used in previous years, to what extent do you feel that the RIP inquiry-based instruction you used this year positively impacted your students’ motivation to learn science and/or other content areas?” The response scale included “none” (‘0’-value), “a slight amount” (‘3’-value), “a moderate amount” (‘6’-value), “a large amount” (‘9’-value), and “completely” (‘12’-value). N=8 2011 Anuenue Cadre 1 RIP teachers. Note: Assumption of normality violated. The data were analyzed with a Wicoxon Signed Rank test (z-approximation): W = 24, z = 2.032, p<0.05. *Location of distribution for Year 2 End-of-Year Questionnaire response values significantly higher than location of distribution for Year 1 End-of-Year Questionnaire response values. |
||||||
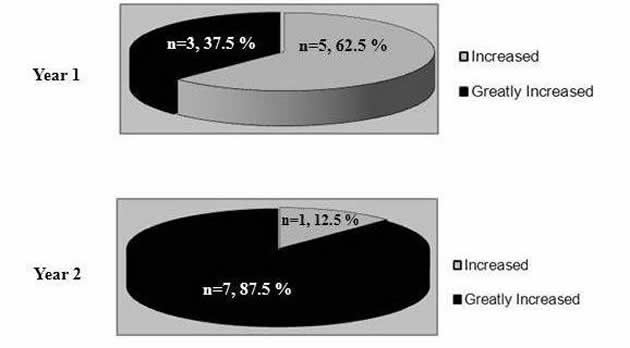
Figure 49. At the end of both Years 1 and 2, all eight Cadre 1 Anuenue Elementary School teachers felt that instruction through inquiry had “increased” or “greatly increased” the interest of their students to learn science This impact of instruction based on scientific inquiry appeared to be greater at the end of Year 2, as the number of teachers who chose “greatly increased” rose from three (37.5%) at the end of the first year to seven (87.5%) at the end of the second year. Anuenue (Year 2): The RIP scientific inquiry process is rigorous and challenging to learn for both teachers and students. Willingness of students to apply the inquiry process to their learning demands confidence. According to Teacher #1, “Because we [teachers] are more confident, our students are more confident in science—STEM” (ANOVA Science Education Corp., 2011).
Pie charts representing End-of-Year 1 (top) and End-of-Year 2 (bottom) teachers’ response to “Engaging my students in learning science through inquiry has __________ their interest in learning science.” The possible responses included “greatly decreased,” “decreased,” “not changed,” “increased,” and “greatly increased.” N=8 Anuenue Elementary School Cadre 1 teachers.
|
||||||
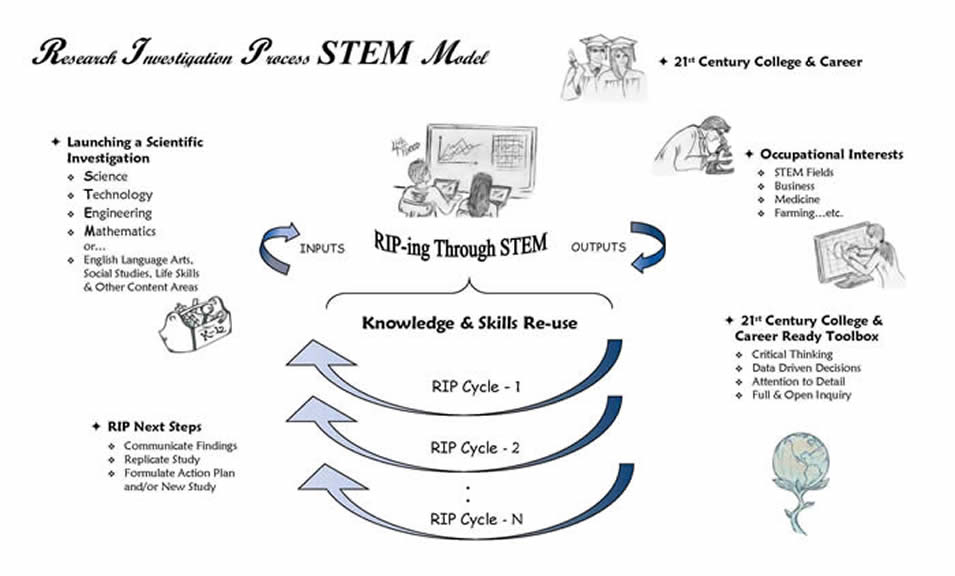
Figure 50. The RIP as a STEM model connecting the student to what is relevant to their own lives, to achievement of standards and the 21st Century skill sets, and empowerment for influencing change in the world.
|
||||||
| The RIP is a STEM model that builds 21st century skill sets through the achievement of standards. The model connects students to what is relevant to their own lives, equipping them to be college and career ready and empowering them to influence change in the world. This figure presents a functional representation of the Research Investigation Process (RIP®) as a STEM model for K-12 education (RIP-ing Through STEM). Students initiate an investigation using this model to answer questions that they find interesting and/or relevant to their lives. The observations, research questions, and decision to launch a scientific investigation (i.e., one that is done scientifically) in STEM and/or any other content area are “inputs” contributed by students. The process (“RIP~ing Through STEM”) that students use to conduct their investigations targets content in any one or a combination of the STEM fields. Scientific and engineering content and practices, as well as mathematics and technology serve as supporting tools within this STEM model. The impact of student and teacher engagement in RIP scientific investigations results are reflected in the “outputs” (“Occupational Interests” and “21st Century College & Career Ready Toolbox”). Included in these outputs are excitement and enjoyment in learning by the student, and critical thinking and decision making STEM-based skill sets developed in students that are mandatory for 21st century success. Long-term impact stimulates occupational interests and the pursuit of higher education and knowledge, all leading to the ability to influence the world. The Cycling feedback feature (“RIP Cycle-1, -2,… -N”) represents STEM building on STEM. As students design subsequent investigations to test and eliminate additional hypotheses and/or reuse knowledge and content and process skills, this will reinforce and solidify their understanding and the abilities to effectively apply this model for use throughout their education and into their adult lives. Ultimately, the RIP~ing Through STEM model provides students with STEM knowledge and skills to support and participate globally in the advancement of the 21st century world. | ||||||
Sample External Evaluator Conclusions Evaluations performed using assessment tools constructed by outside evaluators, state assessments, and ANOVA Science constructed assessments targeting demonstration of skills, understanding of concepts, and attitudes towards science and scientific inquiry have consistently indicated that the RIP is a very successful intervention. The data show that teachers and students for all demographic representations consistently grasp the concepts and practices of this education model of scientific inquiry resulting in the following outside evaluator conclusions.
Jonathan Wang, PhD, DataWise Group, Honolulu, HI (Wang, 2009): It is the conclusion of this evaluator that the program has exceeded its goal of providing RIP training and services to the teachers and students of the Kaimuki Complex. The program has laid the solid foundation including trained teachers, cumulated resources, established partnerships, and gained experiences for continued pursuance of providing excellent educational programs for the students. (P.4)
The RIP model produces a phenomenal paradigm shift away from traditional instructional methods and more student centered learning that is rich with deep critical thinking applications to be phenomenal. It is evident that the participating teachers in Kaimuki Complex are willing and ready to provide more rigorous and meaningful instructions to help their students become critical thinkers and self motivated explorers. (P.4)
It is the conclusion of this evaluator that the data clearly show that, as the result of the RIP PD, participating teachers in Kaimuki Complex have become confident and capable in conducting RIP projects, apply the RIP strategies in their instructions, and transfer the knowledge and skills of scientific inquiry process to their students. (P.5)
Robert Pergolizzi, PHD, Year 1and 2 External Evaluator for RIP~ing@Science in Kaimuki Complex, (Pergolizzi, 2008) In summary, this is a highly successful program as evidenced by an impressive display of benchmark improvements in a traditionally difficult-to-reach population, with regards to science education…there is clear evidence that the program makes it possible for students at all levels, even difficult-to-reach student populations, to not only learn science but to enjoy learning it, and to look forward to learning more about science. (P.5) |
||||||