Evaluation for the 2003 Honolulu District Professional
Development
Program: Teaching
Science Literacy through Inquiry-
The Research
Investigation Process (RIP™)
ANOVA Science
Education Corporation
Honolulu, Hawaii
June 28, 2003
The purpose of this professional development program was to
introduce K-12 teachers to the teaching of science through true scientific
inquiry, using the research investigation process (RIP ä) and to explore the RIP
as a tool for addressing the Hawaii Science Content and Performance Domain I
standards in the classroom.
Specifically, it was designed to guide teachers in the use of the
inquiry process; to have teachers learn how to design and conduct scientific
research studies; to have them become familiar with techniques to assist in
guiding students through the scientific inquiry process; to have them examine,
practice, understand, and become competent in the ability to apply data
analysis techniques to decision-making in science; to increase confidence in
using scientific research in their approach to instructing students in science
and in addressing the scientific inquiry benchmarks and science inquiry content
standards; to have them implement the RIP as a tool for instruction in the
classroom; and to increase student interest in learning science.
Over the course of the initial three-day workshop session,
the research investigation process (RIP) was introduced and teachers were
provided the opportunity to develop an understanding of each of the elements of
the RIP through their participation in and development of actual research
investigations. Teacher participants
were guided through a number of activities related to making observations;
posing research questions; obtaining, examining, and evaluating background
information; constructing hypotheses; and designing the methods for a research
investigation. Techniques in data
summary, analysis and presentation were explored in the context of hypothesis
testing and decision-making in science.
Teachers were then expected to introduce workshop-related concepts and
activities learned into their classroom and guide their students in conducting
their first RIP over the subsequent three months. During the three-month implementation period,
half-day individual teacher/small group follow-up sessions were available to
the participating teachers upon request.
The individual teacher/small group follow-up sessions involved modeling
of instructional techniques and practices with students, assisting teachers on
curriculum development, and/or clarifying concepts presented in the initial
three-day workshop session. The
participants met together again in a final follow-up session at the end of the
three month implementation/individual teacher follow-up period to share their
inquiry-based instructional experiences and student outcomes. All aspects of this workshop were aligned
with the State of Hawaii Science
Content and Performance Standards.
The data for this workshop evaluation were obtained from
assessments of the 25 teacher-participants at the beginning of (Pre-Assessment)
and again at the end (Post-Assessment) of the 3-day initial workshop, and from
questionnaires administered along with the Post-Assessment (Post-Workshop
Questionnaire) and during the follow-up session at the end of the program
(Post-Follow-Up Questionnaire). Items on
the assessments required demonstration of knowledge about the scientific
inquiry process, data analyses procedures, and decision-making in science. A number of these items required teachers to
demonstrate their knowledge through application. Self-report items measured teacher confidence
levels in understanding and using scientific inquiry in the classroom and in
comprehending and applying the scientific inquiry content standards to their
instruction. The response scale for the
confidence items included “not at all confident” (‘0’-value), “somewhat
confident” (‘3’-value), “confident” (‘6’-value), and “completely confident”
(‘9’-value). A concept inventory
determined teachers’ familiarity with and ability to teach elements of
scientific inquiry and data summary and analysis techniques. The answer scale for the concept inventory
items included “I am completely unfamiliar with this concept” (value=1), “I am
somewhat familiar with this concept, but do not really understand what it
means” (value = 2), “I am familiar with this concept , and have a fair
understanding of what it means” (value = 3), “I am very familiar with this
concept, but would have some difficulty teaching it to others” (value = 4), and
“I am completely familiar with this concept and could easily teach it to
others” (value = 5). The pre-workshop and post-workshop assessment
items were the same. The Post-Workshop
Questionnaire containing five items was also administered to assess the
teachers’ perceptions of how much their understanding of scientific inquiry and
the research investigation process changed and improved as a result of
participation in the workshop. Finally,
the Post-Follow-Up Questionnaire, containing a number of the teacher confidence
and perception items on the Pre- and Post-Assessments, as well as additional
items related to the impact of the individual/small group teacher follow-up
sessions and activities on teacher perceptions, was administered. Paired t-tests were used to determine
significant differences (indicating change) between Pre- and Post-Assessment
mean values and between Post-Workshop Questionnaire and Post-Follow-Up
Questionnaire responses. One-way
repeated measures ANOVAs were used to determine significant differences
(indicating change) in responses on items from the common items on the
Pre-Assessment, Post-Assessment, and Post-Follow-Up Questionnaire. In the latter cases, following a significant
effect, Tukey’s Tests were used for multiple comparisons. The criterion for statistical significance (a) for all tests was set at 0.05.
Teacher Knowledge and Understanding of the Scientific
Research Investigation Process (RIP), and Confidence in Teaching Scientific
Inquiry
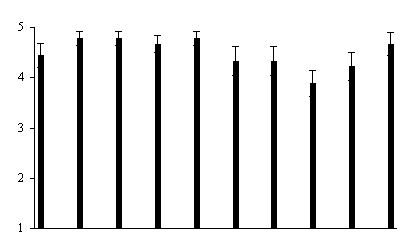
Workshop participants demonstrated a large, statistically
significant increase in their knowledge and understanding of the individual
elements of the RIP by the end of the 3-day workshop (Figure 1, below). This included the logical order of the RIP elements,
understanding of components involved in each element, and demonstration of the
ability to construct testable hypotheses.

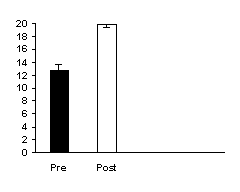
Figure 1. Demonstration of knowledge and understanding
of the elements of the RIP.
There were a total of 25 points available on this
portion of the assessment.
* Mean Post-Assessment score
is significantly greater than mean pre-assessment score [t (24) =
8.56, p<0.001].
The post-workshop increase in teacher-participant knowledge
and understanding of the research process was accompanied by a significant
increase in teacher’ self-reported familiarity and understanding of concepts
related to the scientific research process in the concepts inventory (Figure 2,
below). The average participant’
response rose from “familiar with a fair understanding of the concept” to “very
familiar with the concept with some difficulty in teaching it to others” by the
end of the workshop. This showed that
teachers recognized their increased knowledge and understanding.
Mean (+SEM) RIP Concept Inventory Score
|
|

Figure 2. Familiarity and
understanding of concepts related to elements of the RIP.
The answer scale for the concept inventory items
included “I am completely unfamiliar with this concept” (value=1), “I am
somewhat familiar with this concept, but do not really understand what it
means” (value = 2), “I am familiar with this concept, and have a fair
understanding of what it means” (value = 3), “I am very familiar with this
concept, but would have some difficulty teaching it to others” (value = 4), and
“I am completely familiar with this concept and could easily teach it to
others” (value = 5).
* Mean Post-Assessment score is significantly greater
than mean pre-assessment score [t (24) = 3.91, p<0.001].
By the end of the 3-day workshop, participants’
self-reported confidence levels for their ability to use scientific inquiry,
their understanding of teaching science through inquiry, and their ability to
teach and engage students in scientific research activities all increased
significantly f (Figures 3, 4 and 5, below) from less than “confident” to
“confident” or higher.
Mean (+SEM) Confidence
Score
|
|
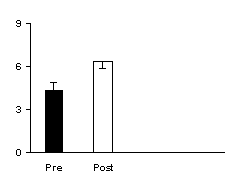
Figure 3. Self-reported
confidence levels for ability to use scientific inquiry. The response scale for the confidence items
included “not at all confident” (‘0’-value), “somewhat confident” (‘3’-value),
“confident” (‘6’-value), and “completely confident” (‘9’-value).
·
Mean Post-Assessment score is significantly greater than mean pre-assessment
score [t (24) = 5.20, p<0.001].
Mean (+SEM) Confidence
Score
|
|
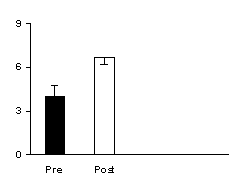
Figure 4. Self-reported
confidence levels for understanding of teaching science through inquiry. The response scale for the confidence items
included “not at all confident” (‘0’-value), “somewhat confident” (‘3’-value),
“confident” (‘6’-value), and “completely confident” (‘9’-value).
*Mean Post-Assessment score is significantly greater
than mean pre-assessment score [t (24) = 4.81, p<0.001].
Mean (+SEM) Confidence
Score
|
|


Figure 5. Self-reported
confidence levels for ability to teach and engage students in scientific
research activities. The response scale
for the confidence items included “not at all confident” (‘0’-value), “somewhat
confident” (‘3’-value), “confident” (‘6’-value), and “completely confident”
(‘9’-value).
* Mean Post-Assessment score
is significantly greater than mean pre-assessment score [t (24) =
4.58, p<0.001].
Teacher Understanding of and Ability to Apply Data
Summary, Presentation, and Analysis techniques to Decision-Making in Science
By the end of the workshop, participants demonstrated a
large, statistically significant increase, almost doubling their Pre-Assessment
score, in their knowledge and ability to correctly organize data into a summary
table and to construct a bar graph for comparing the central tendency for two
groups of data (Figure 6, below).
Mean (+SEM) Data Summary & Presentation Score
|
|
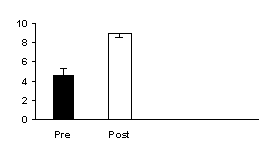
Figure 6.
Demonstration of understanding and ability to apply data organization
and presentation techniques to data.
This section was worth a total of 10 points.
* Mean Post-Assessment score
is significantly greater than mean pre-
assessment score [t (24) = 6.52, p<0.001].
Workshop participants also demonstrated a dramatic change in
their knowledge and ability to apply data analysis techniques to research
data. Comparison of the pre-and
Post-Assessments revealed that by the end of the workshop, they significantly
increased their understanding of how to calculate descriptive statistics and their
ability to determine which measure of central tendency is most appropriate for
a group of data (Figure 7, below).
Mean (+SEM) Data Analysis Score
|
|
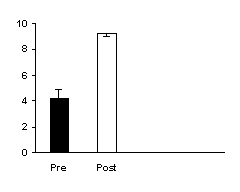
Figure 7.
Demonstration of understanding of the calculations for descriptive
statistics and ability to determine the most appropriate statistic to represent
central tendency for a group of data.
This section was worth a total of 10 points.
* Mean Post-Assessment score
is significantly greater than mean pre-assessment score [t (24) =
8.21, p<0.001].
Participants demonstrated a statistically
significant increase in their ability to interpret data presented in
scatterplots and summarized in bar graphs by the end of the workshop (Figure 8,
below).
Mean (+SEM) Graph Interpretation Score
|
|
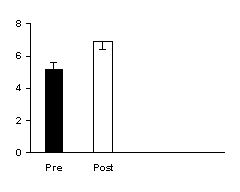
Figure 8.
Demonstration of ability to interpret scatterplots and bar graphs. This section was worth a total of 10 points.
* Mean Post-Assessment score
is significantly greater than mean pre-assessment score [t (24) =
4.90, p<0.001].
The participant increase
in knowledge of and ability to apply data presentation and analyses were
accompanied by a significant increase in teacher’ self-reported familiarity and
understanding of concepts related to data presentation and analysis in the
concepts inventory (Figures 9 and 10, below).
By the end of the workshop, the average participant’ response for the
three measures of central tendency rose significantly from between “somewhat
familiar with concept, but do not really understand what it means” and “I am
familiar with this concept, and have a fair understanding of what it means” to between “I very
familiar with this concept but would have some
difficulty teaching it to others” and “I am
completely familiar with this concept and could easily teach it to others (Figure 9).
Mean (+SEM) Central Tendency Concept Inventory
Score
|
|
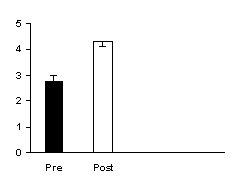
Figure 9. Familiarity and
understanding of concepts related to measuring central tendency. The answer scale for the concept inventory
items included “I am completely unfamiliar with this concept” (value=1), “I am
somewhat familiar with this concept, but do not really understand what it
means” (value = 2), “I am familiar with this concept, and have a fair
understanding of what it means” (value = 3), “I am very familiar with this
concept, but would have some difficulty teaching it to others” (value = 4), and
“I am completely familiar with this concept and could easily teach it to
others” (value = 5).
* Mean Post-Assessment score is significantly greater
than mean pre-assessment score [t (23) = 7.11, p<0.001].
Similarly, the average participant’ concept inventory
response for tables and graphs rose significantly from “familiar with the
concept with a fair understanding of what it means” to “very familiar with the
concept, but would have some difficulty teaching it to others” (Figure
10).
Mean (+SEM) Tables & Graphs Concept Inventory
Score
|
|
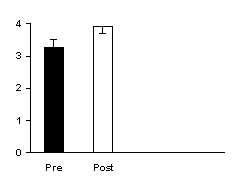
Figure 10. Familiarity and
understanding of concepts related to tables and graphs. The answer scale for the concept inventory
items included “I am completely unfamiliar with this concept” (value=1), “I am
somewhat familiar with this concept, but do not really understand what it
means” (value = 2), “I am familiar with this concept, and have a fair
understanding of what it means” (value = 3), “I am very familiar with this
concept, but would have some difficulty teaching it to others” (value = 4), and
“I am completely familiar with this concept and could easily teach it to
others” (value = 5).
*Mean Post-Assessment score
is significantly greater than mean pre-assessment score [t (24) =
4.57, p<0.001].
Benchmarks and Standards
General teacher
confidence in and awareness of ability to understand and apply scientific
inquiry to the teaching of science, and in ability to successfully address the
scientific inquiry standards, was enhanced by their participation in the
workshop. Participant self-reported
confidence in ability to address content standards in the classroom rose
significantly from less than “confident” to above “confident” by the end of the
workshop (Figure 11, below).
Mean (+SEM) Confidence
Score
|
|
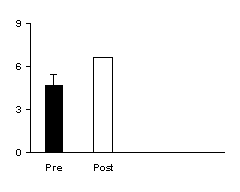
Figure 11. Self-reported
confidence levels for ability to address content standards in the
classroom. The response scale for the
confidence items included “not at all confident” (‘0’-value), “somewhat
confident” (‘3’-value), “confident” (‘6’-value), and “completely confident”
(‘9’-value).
* Mean
Post-Assessment score is significantly greater than mean Pre-Assessment score [t
(24) = 3.71, p<0.001].
Similarly, by the end of the workshop, participant
confidence about ability to accurately and completely address the scientific
inquiry standards dramatically increased from “somewhat confident” to above
“confident” (Figure 12, below).
Mean (+SEM) Confidence
Score
|
|
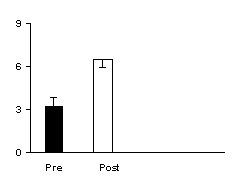
Figure 12. Self-reported
confidence levels for ability to accurately and completely address the
scientific inquiry benchmarks. The
response scale for the confidence items included “not at all confident”
(‘0’-value), “somewhat confident” (‘3’-value), “confident” (‘6’-value), and
“completely confident” (‘9’-value).
* Mean
Post-Assessment score is significantly greater than mean pre-assessment score [t
(24) = 7.05, p<0.001].
Finally, by the end of the 3-day workshop, teachers
significantly increased their familiarity and understanding of inquiry
standards from being “somewhat familiar with this concept,” but not really
understanding what it means to being between “familiar
with this concept, with “a fair understanding of what it means” and “very
familiar” with this concept, but with “would have some difficulty teaching it
to others.” This increase was
statistically significant and was consistent with the increase in
teacher-participant confidence regarding scientific inquiry and addressing the
inquiry standards (Figure 13, below).
Mean (+SEM) Inquiry Standards Concept Inventory
Score
|
|
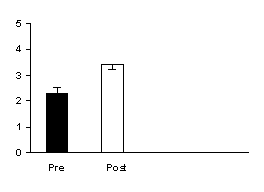
Figure 13. Familiarity and
understanding of concept of inquiry standards.
The answer scale for the concept inventory items included “I am
completely unfamiliar with this concept” (value=1), “I am somewhat familiar
with this concept, but do not really understand what it means” (value = 2), “I
am familiar with this concept, and have a fair understanding of what it means”
(value = 3), “I am very familiar with this concept, but would have some
difficulty teaching it to others” (value = 4), and “I am completely familiar
with this concept and could easily teach it to others” (value = 5).
*Mean
Post-Assessment score is significantly greater than mean pre-assessment score [t
(24) = 4.96, p<0.001].
Teacher
Perceptions of Impact of their Participation in the Initial Three-Day Workshop
The Post-Workshop Questionnaire administered with
the Post-Assessment contained five self-report items designed to assess how
much teacher-participants believed their knowledge and abilities regarding the
scientific research investigation process and scientific inquiry were impacted
by their participation in this workshop.
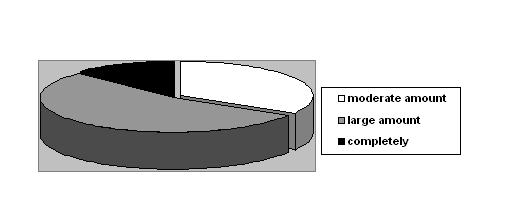
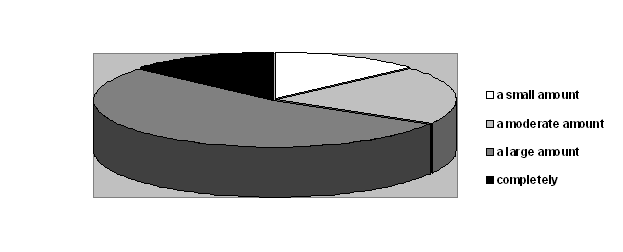
The results from these items are presented in Figures 14-19 below. Seventy-percent (17 of 24) of the participants
claimed that their understanding of the research investigation process was changed a “large amount” to “completely”
as a result of their participation in this workshop, while seven of the
participants claimed it changed a “moderate” to a “large amount” (Figure 14,
below).
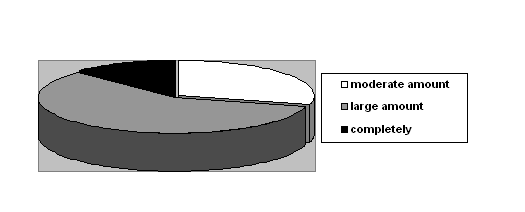
Figure
14. Pie chart representing 24
teacher-participants’ responses to “what extent, if any, did your understanding
of the research investigation process change as a result of your participation
in this workshop?” The scale for
responses included “none,” “a small
amount,” “a moderate amount,” “a large
amount,” and “completely.”
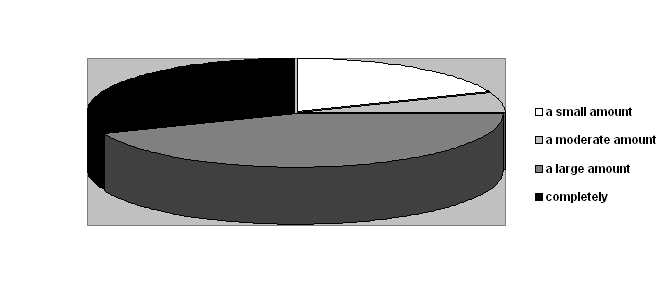
Two-thirds (16 of 24) of the workshop-participants
claimed that their understanding of the research investigation process improved a “large amount” to
“completely” as a result of their participation in the 3-day workshop (Figure
15, below). The remaining eight
participants claimed it improved a “moderate” to a “large amount” as a result
of their participation.
Figure
15. Pie chart representing 24
teacher-participants’ responses to “what extent, if any, did your understanding
of the research investigation process become clearer as a result of your
participation in this workshop?” The
scale for responses included “none,” “a
small amount,” “a moderate amount,” “a
large amount,” and “completely.”
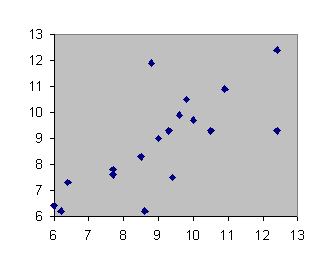
Figure 16 presents a scatterplot of the
teacher-reported increase in understanding of the research investigation
process plotted as a function of change in understanding of the research
investigation process, both as a result of participation in the workshop.
|
|
|
|
|
|
|
|
 |
|
Amount of
Increase in Understanding
|
|
|
|
|
|
Amount of Change in Understanding
|
|
Figure
16. Scatterplot of increase in
understanding as a function of change in understanding of the research
investigation process, both resulting from participation in the workshop.
As can be seen in Figure 16 above, there was a
moderate, statistically significant, positive relationship between the amount
of change and the amount of increase in understanding of the scientific
research investigation process.
Approximately 63% of the increase in understanding was associated with
the change in understanding.
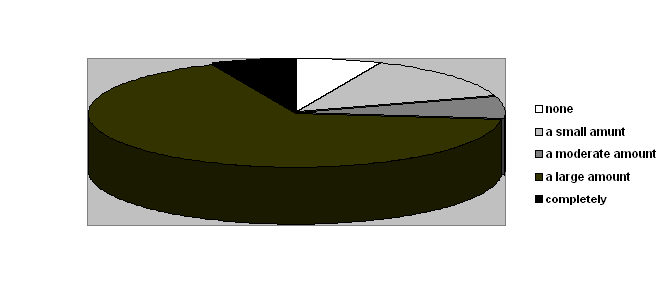
More than half of the workshop-participants (14 of
24) claimed that their understanding of how to analyze research data was
“substantially” or “dramatically” increased as a result of their participation
in this workshop. One-third of the
participants reported that their understanding increased “moderately” and the
remaining eight-percent “slightly” (Figure 17, below).
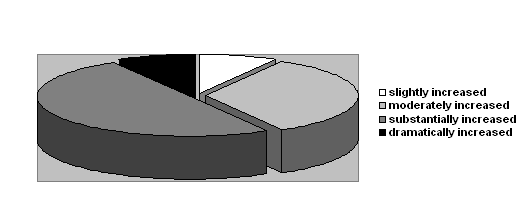
Figure
17. Pie chart representing 24
teacher-participants’ responses to completion of, “as a result of my
participation in this workshop, my understanding of how to analyze research
data has ______________.” The scale for
responses included “remained unchanged,” “slightly increased,” “a moderately
increased,” “substantially increased,” “and “dramatically increased.”
The majority of the workshop-participants (16 of 24
or 66%) “strongly” or “moderately” agreed that their involvement in the initial
three-day workshop increased their ability to engage their students in
standards-based science learning through scientific inquiry (Figure 18,
below). Thirty-percent of the
participants “slightly” agreed and one neither agreed nor disagreed that their
involvement increased this ability.
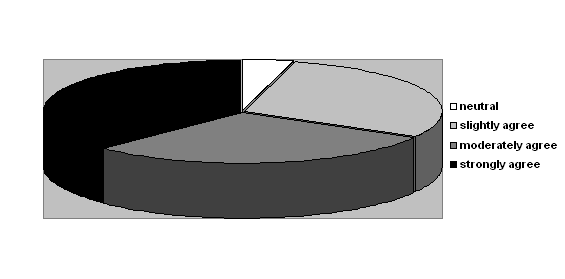
Figure
18. Pie chart representing
teacher-participants’ degree of agreement with “My involvement in this workshop
has increased my ability to engage my students in standards-based science
through scientific inquiry.” The scale
for responses included “strongly disagree,” “moderately disagree,” “slightly
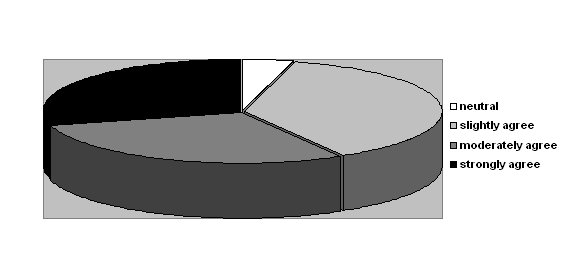
disagree,” “neutral,” “slightly agree,” “moderately agree,” “strongly agree.”
Again, more than half of the workshop-participants
(14 of 24) “strongly” or “moderately” agreed that their involvement in the
initial three-day workshop increased their ability to develop a standards-based
unit incorporating the research investigation process (Figure 19, below). However, almost 40% of the teachers only
“slightly” agreed and one neither agreed nor disagreed that their participation
increased this ability.
Figure
19. Pie chart representing
teacher-participants’ degree of agreement with “My involvement in this workshop
has increased my ability to develop a standards-based unit incorporating the
research investigation process.” The
scale for responses included “strongly disagree,” “moderately disagree,” “slightly
disagree,” “neutral,” “slightly agree,” “moderately agree,” “strongly agree.”
Impact
of Implementation and Follow-Up Sessions
After the initial 3-day workshop, the teachers were
expected to begin to introduce and implement the RIP into their teaching
curriculum. There were two components of
follow-up in this professional development program: 1) the in-school/classroom
follow-up activities with the science literacy project director and individual
teachers or small groups of teachers and 2) the final one-day follow-up session
in which teachers had the opportunity to share the successes and challenges
that they and their students encountered during implementing of the RIP into
their classroom curricula. A Post-Follow-Up
Questionnaire, administered during the final one-day follow-up session, was
used to gather information related to the impact of the entire workshop on
teacher understanding of, and ability and confidence in using the RIP as a tool
to address science education standards, as well as for comparison with pre- and
post-assessment values from the initial three-day workshop sessions and values
from the Post-Workshop Questionnaire.
Additional items were included on the Post-Follow-Up Questionnaire to
directly assess the impact of the in-school/classroom follow-up activities on
participant perceptions of achievement of the workshop objectives.
Pre-
versus post-implementation and follow-up activities
Overall, although it is clear that substantial gains
in teacher knowledge about and ability to use and implement scientific inquiry
were achieved through the initial 3-day workshop, the implementation and
follow-up experiences led to considerable additional gains in the participants’
confidence and perceived ability to introduce the RIP to their students and
successfully address the science content standards.
Teacher-confidence in ability to use scientific
inquiry at the end of the program was significantly higher than before or after
the initial 3-day workshop (Figure 20, below).
Teachers were more than “confident” about their ability at the end of
the implementation and follow-up activities compared to “confident” after, and
slightly more than “somewhat confident” before the initial 3-day workshop. This suggests that the implementation of inquiry-based
science instruction in the classroom and the individual follow-up activities
positively impacted program-participants’ confidence.
Mean (+SEM) Confidence Score
|
|
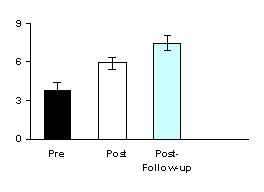
Figure 20. Teachers’ self-reported
confidence in their ability to use scientific inquiry. The response scale for the confidence items
included “not at all confident” (‘0’-value), “somewhat confident” (‘3’-value),
“confident” (‘6’-value), and “completely confident” (‘9’-value). N=9, two participants did not respond to this
item.
One-way repeated
measures ANOVA: F(2,32) = 23.31, p<0.001
*Mean
post-workshop confidence is significantly greater than mean pre-workshop
confidence; mean post-follow-up confidence is significantly greater than mean
pre-workshop confidence; ** Mean post-follow-up confidence is significantly
greater than mean post-workshop confidence
Program participants exhibited significantly higher
confidence in their ability to teach and engage their students in scientific
research activities following the implementation of the RIP into the classroom
and participation in individual follow-up compared with pre-3-day workshop
confidence levels (Figure 21, below).
Although not statistically significant, implementation of the RIP into
the classroom and individual follow-up activities resulted in a trend for
increased self-reported confidence compared with confidence levels following
the initial 3-day workshop (Figure 21, below).
Mean (+SEM) Confidence
Score
|
|
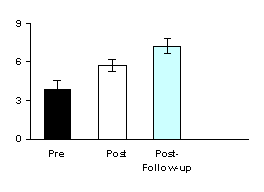
Figure 21. Teachers’
self-reported confidence in their ability to teach and engage their students in
scientific research activities.
One-way repeated
measures ANOVA: F(2,32) = 14.37, p<0.001
*Mean
post-workshop confidence is significantly greater than mean pre-workshop
confidence; mean post-follow-up confidence is significantly greater than mean
pre-workshop confidence. Although a
statistically significant difference was not obtained, there was a trend for a
difference between the mean post-follow-up confidence and mean post-workshop
confidence levels.
Self-confidence in the
participants’ understanding of teaching science through inquiry was
significantly higher following both the initial 3-day workshop and the
classroom implementation and follow-up activities. However, the follow-up did not increase
participant confidence above the post-3-day workshop confidence level (Figure
22, below).
Mean (+SEM) Confidence
Score
|
|
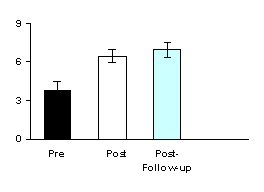
Figure 22. Teachers’
self-reported confidence in their understanding of teaching science through inquiry. The response scale for the confidence items
included “not at all confident” (‘0’-value), “somewhat confident” (‘3’-value),
“confident” (‘6’-value), and “completely confident” (‘9’-value).
One-way repeated
measures ANOVA: F(2,32) = 11.73, p<0.001
*Mean
post-workshop confidence is significantly greater than mean pre-workshop
confidence; mean post-follow-up confidence is significantly greater than mean
pre-workshop confidence
Teacher confidence in
ability to address content standards in the classroom was significantly higher
than pre-workshop levels following the 3-day workshop and the implementation
and follow-up. By the end of the
classroom implementation and follow-up, confidence levels had significantly
increased to between “confident” and “very confident” from a pre-initial
workshop level of around less than “confident” (Figure 23, below).
Mean (+SEM) Confidence
Score
|
|
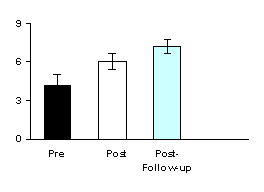
Figure 23. Teachers’
self-reported confidence in their ability to address content standards in their
classroom. The response scale for the
confidence items included “not at all confident” (‘0’-value), “somewhat
confident” (‘3’-value), “confident” (‘6’-value), and “completely confident”
(‘9’-value).
One-way repeated
measures ANOVA: F(2,32) = 9.36, p<0.001
*Mean
post-workshop confidence is significantly greater than mean pre-workshop
confidence; mean post-follow-up confidence is significantly greater than mean
pre-workshop confidence
After implementation of
the RIP into the classroom and individual follow-up, participant confidence in
their ability to completely and accurately address the scientific inquiry
benchmarks was higher compared with confidence levels at the end of the initial
3-day workshop (Figure 24, below).
Self-reported confidence levels were raised significantly from
“confident” after the 3-day workshop to between “confident” and “very
confident” after the implementation and follow-up activities.
Mean (+SEM) Confidence
Score
|
|
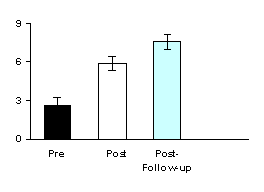
Figure 24. Teachers’
self-reported confidence in their ability to accurately address the scientific
inquiry benchmarks. The response scale
for the confidence items included “not at all confident” (‘0’-value), “somewhat
confident” (‘3’-value), “confident” (‘6’-value), and “completely confident”
(‘9’-value).
One-way repeated
measures ANOVA: F(2,32) = 29.30, p<0.001
*Mean
post-workshop confidence is significantly greater than mean pre-workshop
confidence; mean post-follow-up confidence is significantly greater than mean
pre-workshop confidence; ** Mean post-follow-up confidence is significantly
greater than mean post-workshop confidence
There
was no difference in impact from implementation of the RIP into the classroom
and individual follow-up compared with that of the initial 3-Day workshop on
teachers’ self-reported increases in their understanding of how to analyze
research data (Figure 25, below). In
each case, program participants reported “substantial” increases in
understanding.
Mean (+SEM) Increase Score
|
|
Workshop
Assessment Session
|
|
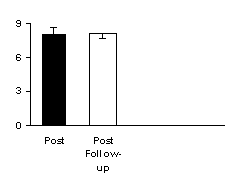
Figure 25. Teacher self-reported
increase in understanding of how to analyze research data after the initial
3-day workshop session (Post) compared to after participating in the entire
program (Post Follow-up).
* Mean
post-follow-up assessment value was not statistically different from the mean
post-3-day assessment value [t (26) = .63, p>0.05].
Compared to after the initial 3-day workshop, after
participation in the implementation and follow-up activities, program participants
reported a slightly greater, statistically significant, positive impact on
their ability to engage their students in standards-based science learning
through scientific inquiry (Figure 26, below).
Workshop Assessment Session
|
|
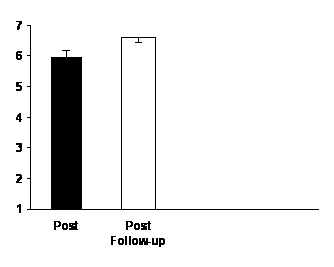
Figure 26. The extent to which
teachers agreed with the statement, “My involvement in this workshop has
increased my ability to engage my students in standards-based science learning
through scientific inquiry,” after the three-day workshop session (Post)
compared to after the follow-up session.
*Mean
post-follow-up assessment value was significantly greater than the
mean post-3-day assessment value [t (15)
= 2.45, p<0.03].
Teacher-participant perception of their ability to develop a
standards-based unit incorporating the research investigation process was
significantly higher after the implementation and follow-up activities compared
to after the 3-day initial workshop participation (Figure 27, below).
Workshop Assessment Session
|
|
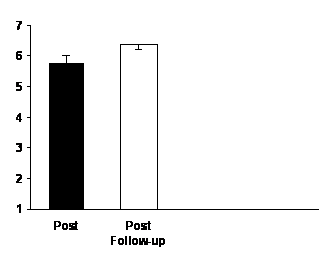
Figure 27. The extent to which
teachers agreed with the statement, “My involvement in this workshop has
increased my ability to develop a standards-based unit incorporating the
research investigation process,” after the three-day workshop session (Post)
compared to after the follow-up session.
*Mean
post-follow-up assessment value was significantly greater than the
mean post-3-day assessment value [t (15)
= 2.97, p=0.01].
All of the workshop-participants who attended the
final follow-up session responded that their use of scientific inquiry in the
classroom had “increased” or “greatly increased” since participating in the
program (Figure 28, below).
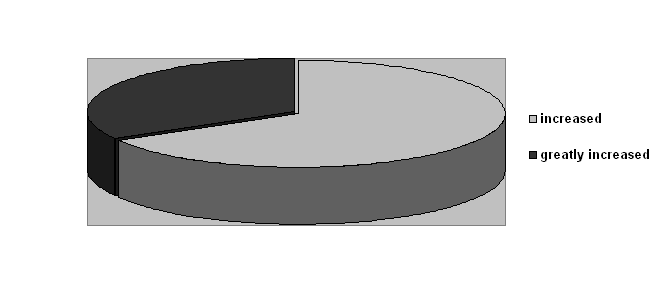
Figure
28. Pie chart representing
teacher-participant responses in completing the following sentence: “Since
participating in this inquiry workshop program, my use of scientific inquiry in
the classroom __________.” The scale for
responses included “greatly decreased,” “decreased,” “remained unchanged,”
“increased,” and “greatly increased.”
All of the workshop-participants who attended the
final follow-up session responded that engaging their students in learning
science through inquiry “increased” or “greatly increased” their students’
interest in learning science (Figure 29, below).
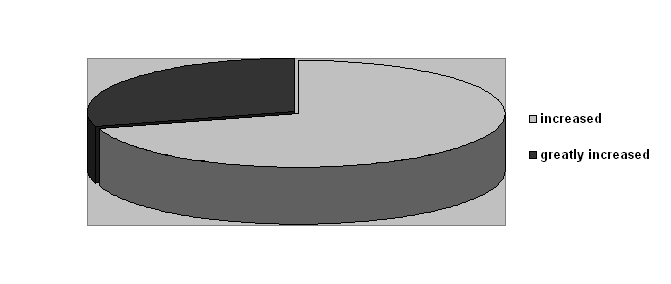
Figure
29. Pie chart representing
teacher-participant responses in completing the following sentence: “Engaging
my students in learning science through inquiry has __________ their interest in learning
science.” The scale for responses
included “greatly decreased,” “decreased,” “remained unchanged,” “increased,”
and “greatly increased.” One of the
eighteen participants who attended the follow-up session did not respond to
this item.
Evaluation of in-school/classroom follow-up session impact
Almost three-quarters of the program-participants
who participated in individual follow-up activities responded that their
follow-up experience enhanced the quality of their classroom inquiry
experiences with their students “a large amount” or “completely,” while two
reported a “moderate” and two a “small amount” of enhancement (Figure 30,
below).
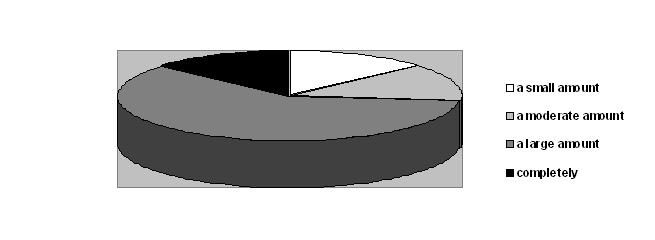
Figure
30. Pie chart representing
teacher-participant responses to the question, “To what extent, if any, did the
follow-up sessions enhance the quality of your classroom inquiry experiences
with you students?” The scale for responses
included “none,” “a small amount,” “a moderate amount,” “a large amount,” and
“completely.” One of the 16 teachers who
participated in the individual follow-up activities did not respond to this
item.
Eleven of sixteen, or more than two-thirds, of the
workshop-participants who participated in individual follow-up stated that
their participation in the follow-up contributed “a large amount” or
“completely” to their ability to implement the RIP with their students (Figure
31, below).
Figure
31. Pie chart representing
teacher-participant responses about the extent to which the follow-up sessions
contributed to their ability to implement the RIP with their students. The scale for responses included “none,” “a small amount,” “a moderate amount,” “a large amount,” and
“completely.”
Three quarters of the workshop-participants who
participated in individual follow-up responded that their participation
contributed “a large amount” or “completely” to changes in their understanding
of the research investigation (Figure 32, below).
Figure
32. Pie chart representing
teacher-participant responses as to the extent to which the follow-up sessions
changed their understanding of a research investigation. The scale for responses included “none,” “a small amount,” “a moderate amount,” “a large amount,” and
“completely.”
A majority (11 of 15) of the teachers who took part
in individual follow-up responded that their participation resulted in a
clearer understanding of the RIP (Figure 33, below).
Figure
33. Pie chart representing
teacher-participant responses as to the extent to which the follow-up sessions
increased the clarity of their understanding of the RIP.
The scale for responses included “none,”
“a small amount,” “a moderate
amount,” “a large amount,” and
“completely.” One of the 16 teachers who
participated in the individual follow-up activities did not respond to this
item.
PD-Credit Evaluation Items
The Hawaii State DOE Professional Development
(PD)-Credit Evaluation was administered to the 9 teachers who were taking this
science literacy/inquiry program for credits.
Figure 34 below presents then mean teacher responses for each of the ten
items on the PD Evaluation. All of the
ten PD-Credit items pertaining to this science literacy/inquiry program
exceeded the “more than meets” the standard criterion, with five of those
closely approaching “meets to a high degree.”
|
Degree to
which Item
Meets the
Standard
(Mean + SEM)
|
|
|
|
|
Figure 34. Honolulu District 2003 Science
Literacy-Scientific Inquiry Professional Development Workshop.
Items: 1)
focuses on Hawaii Content and Performance Standards, 2) focuses on student
learning, 3) results-oriented, 4) appropriate content, on-going and sustained,
5) active engagement, 6) collegial, 7) job-embedded, 8) systemic perspective,
9) client-focused and adaptive, and 10) incorporates reflection
Program
Evaluation Summary
Based on the findings from this evaluation, Teaching Science Literacy through Inquiry-The
Research Investigation Process (RIP) successfully introduced K-12 teachers
to the teaching of science through true scientific inquiry, meeting or
exceeding the program’s goals in all aspects of professional development
assessed. The professional development
program successfully instructed teachers in using the research investigation
process (RIP) and afforded them the opportunity to explore the RIP as a tool
for addressing the Hawaii Science Content and Performance Domain I
standards. Teacher-participants learned
to use the inquiry process and to design and conduct scientific research
studies; became familiar with techniques
to assist in guiding students through the scientific inquiry process;
demonstrated understanding of, and competence in the ability to apply data
analysis techniques to decision-making in science; reported increased
confidence in using scientific research in their approach to instructing
students in science and in addressing the scientific inquiry benchmarks and
science inquiry content standards; successfully implemented the RIP as a tool
for instruction in the classroom; and reported increased student interest in
the learning of science.
Although the
implementation into the classroom and follow-up activities appeared to have had
a strong impact on the success of this program, interpretation of these data
should be made with caution. To ensure
that measured effects from comparisons of measurements taken after the initial
3-day workshop and again after implementation and follow-up activities were
caused by these activities and not the passage of time, control groups of
teachers who did not participate in either one or both of these post initial
3-day workshop activities should be included.
Inclusion of these control groups within this scientific
literacy/inquiry project was not possible for both practical and ethical
reasons.